Status Visualization
此内容尚不支持你的语言。
Controller is equipped with powerful device status monitoring function, which can monitor the working status of switches and wireless APs in real time. Through the detailed dashboard display, administrators can grasp the operating status of the equipment at any time. Based on the acquired monitoring information, the controller evaluates various indicators and intelligently calculates the health value of each device. The health value is evaluated by considering the following factors:
- Resource utilization: Based on the memory and CPU utilization, evaluate the use of device resources and whether there is a risk of resource exhaustion.
- Traffic load: Based on traffic statistics, analyze the load of the device and determine whether there is a traffic bottleneck.
- Hardware Status: Monitor the temperature of each component of the device, the operation of the power supply, fan and other hardware, whether it is within the expected range.
- Running status: detect the running status of each major process and container of the device in real time.
When the monitoring index exceeds the preset threshold, the controller will automatically generate an alarm message to notify the administrator to ensure that the administrator can find and solve the problem in a timely manner to ensure the efficient, safe and stable operation of the network.
The controller supports full volume calculation of monitoring data from all online devices, and finally presents them globally as a comprehensive health value.
Organization Dashboard
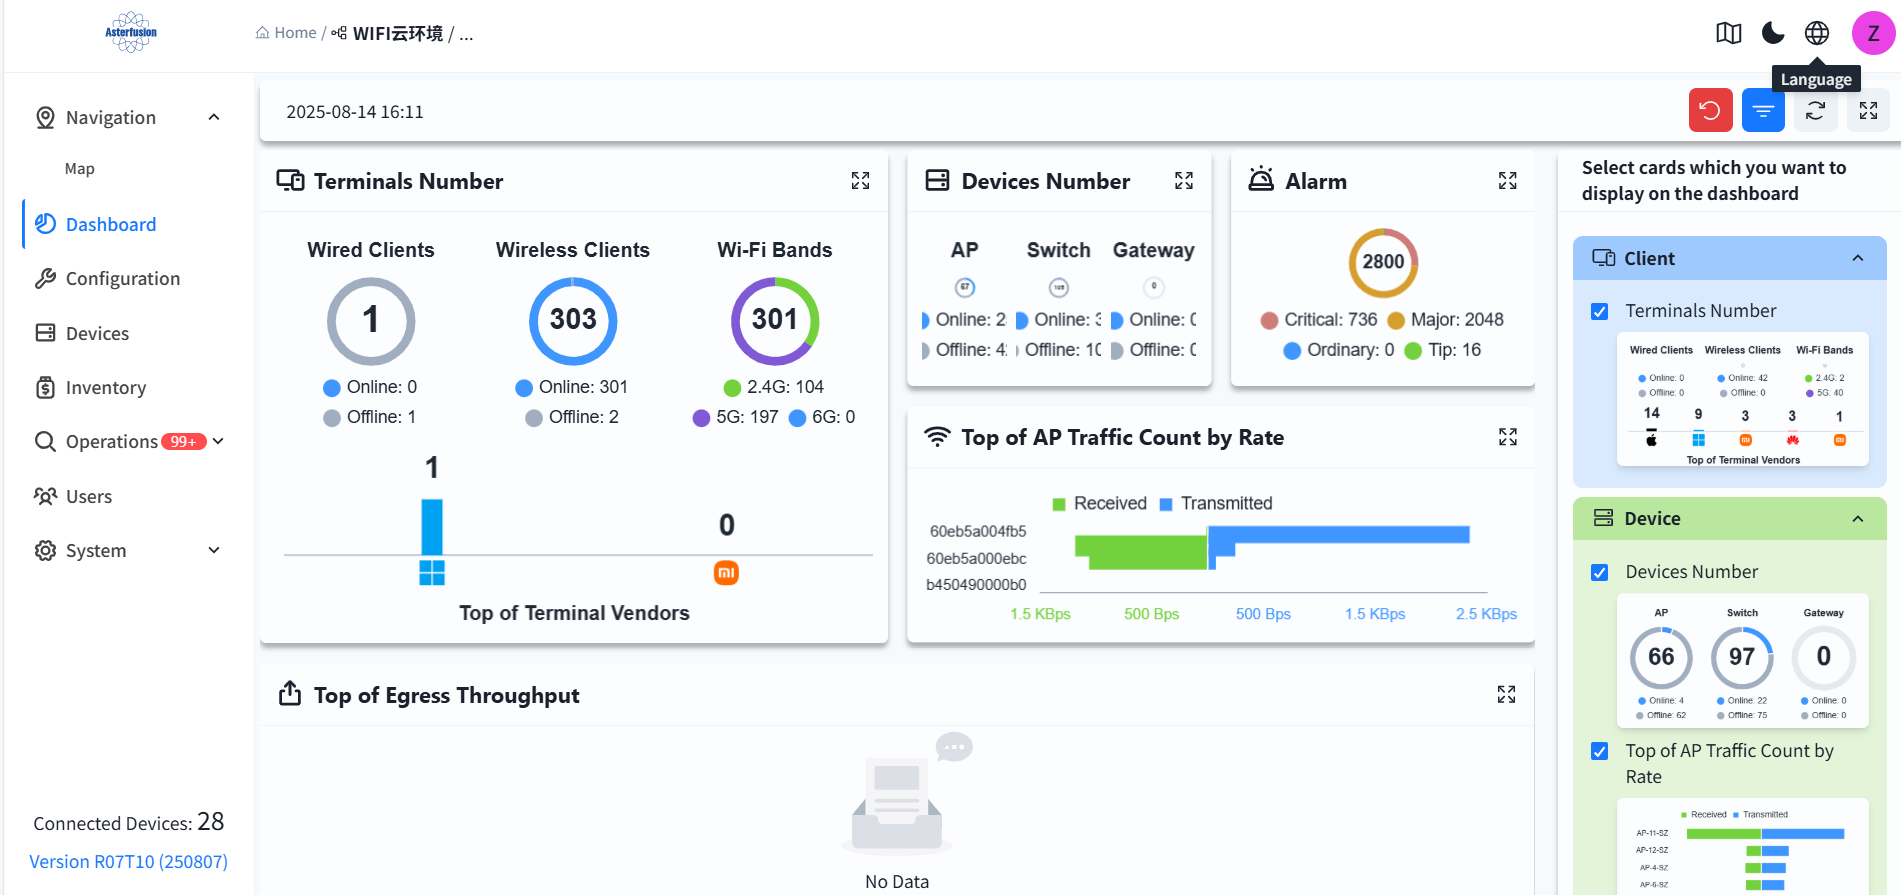
Section titled “Organization Dashboard”Administrators can enter the specific organization in the [Navigation] screen to view an overview of the status of devices and terminals under all premises within the organization. You can also adjust the display cards according to your own preferences.
Venue Dashboard
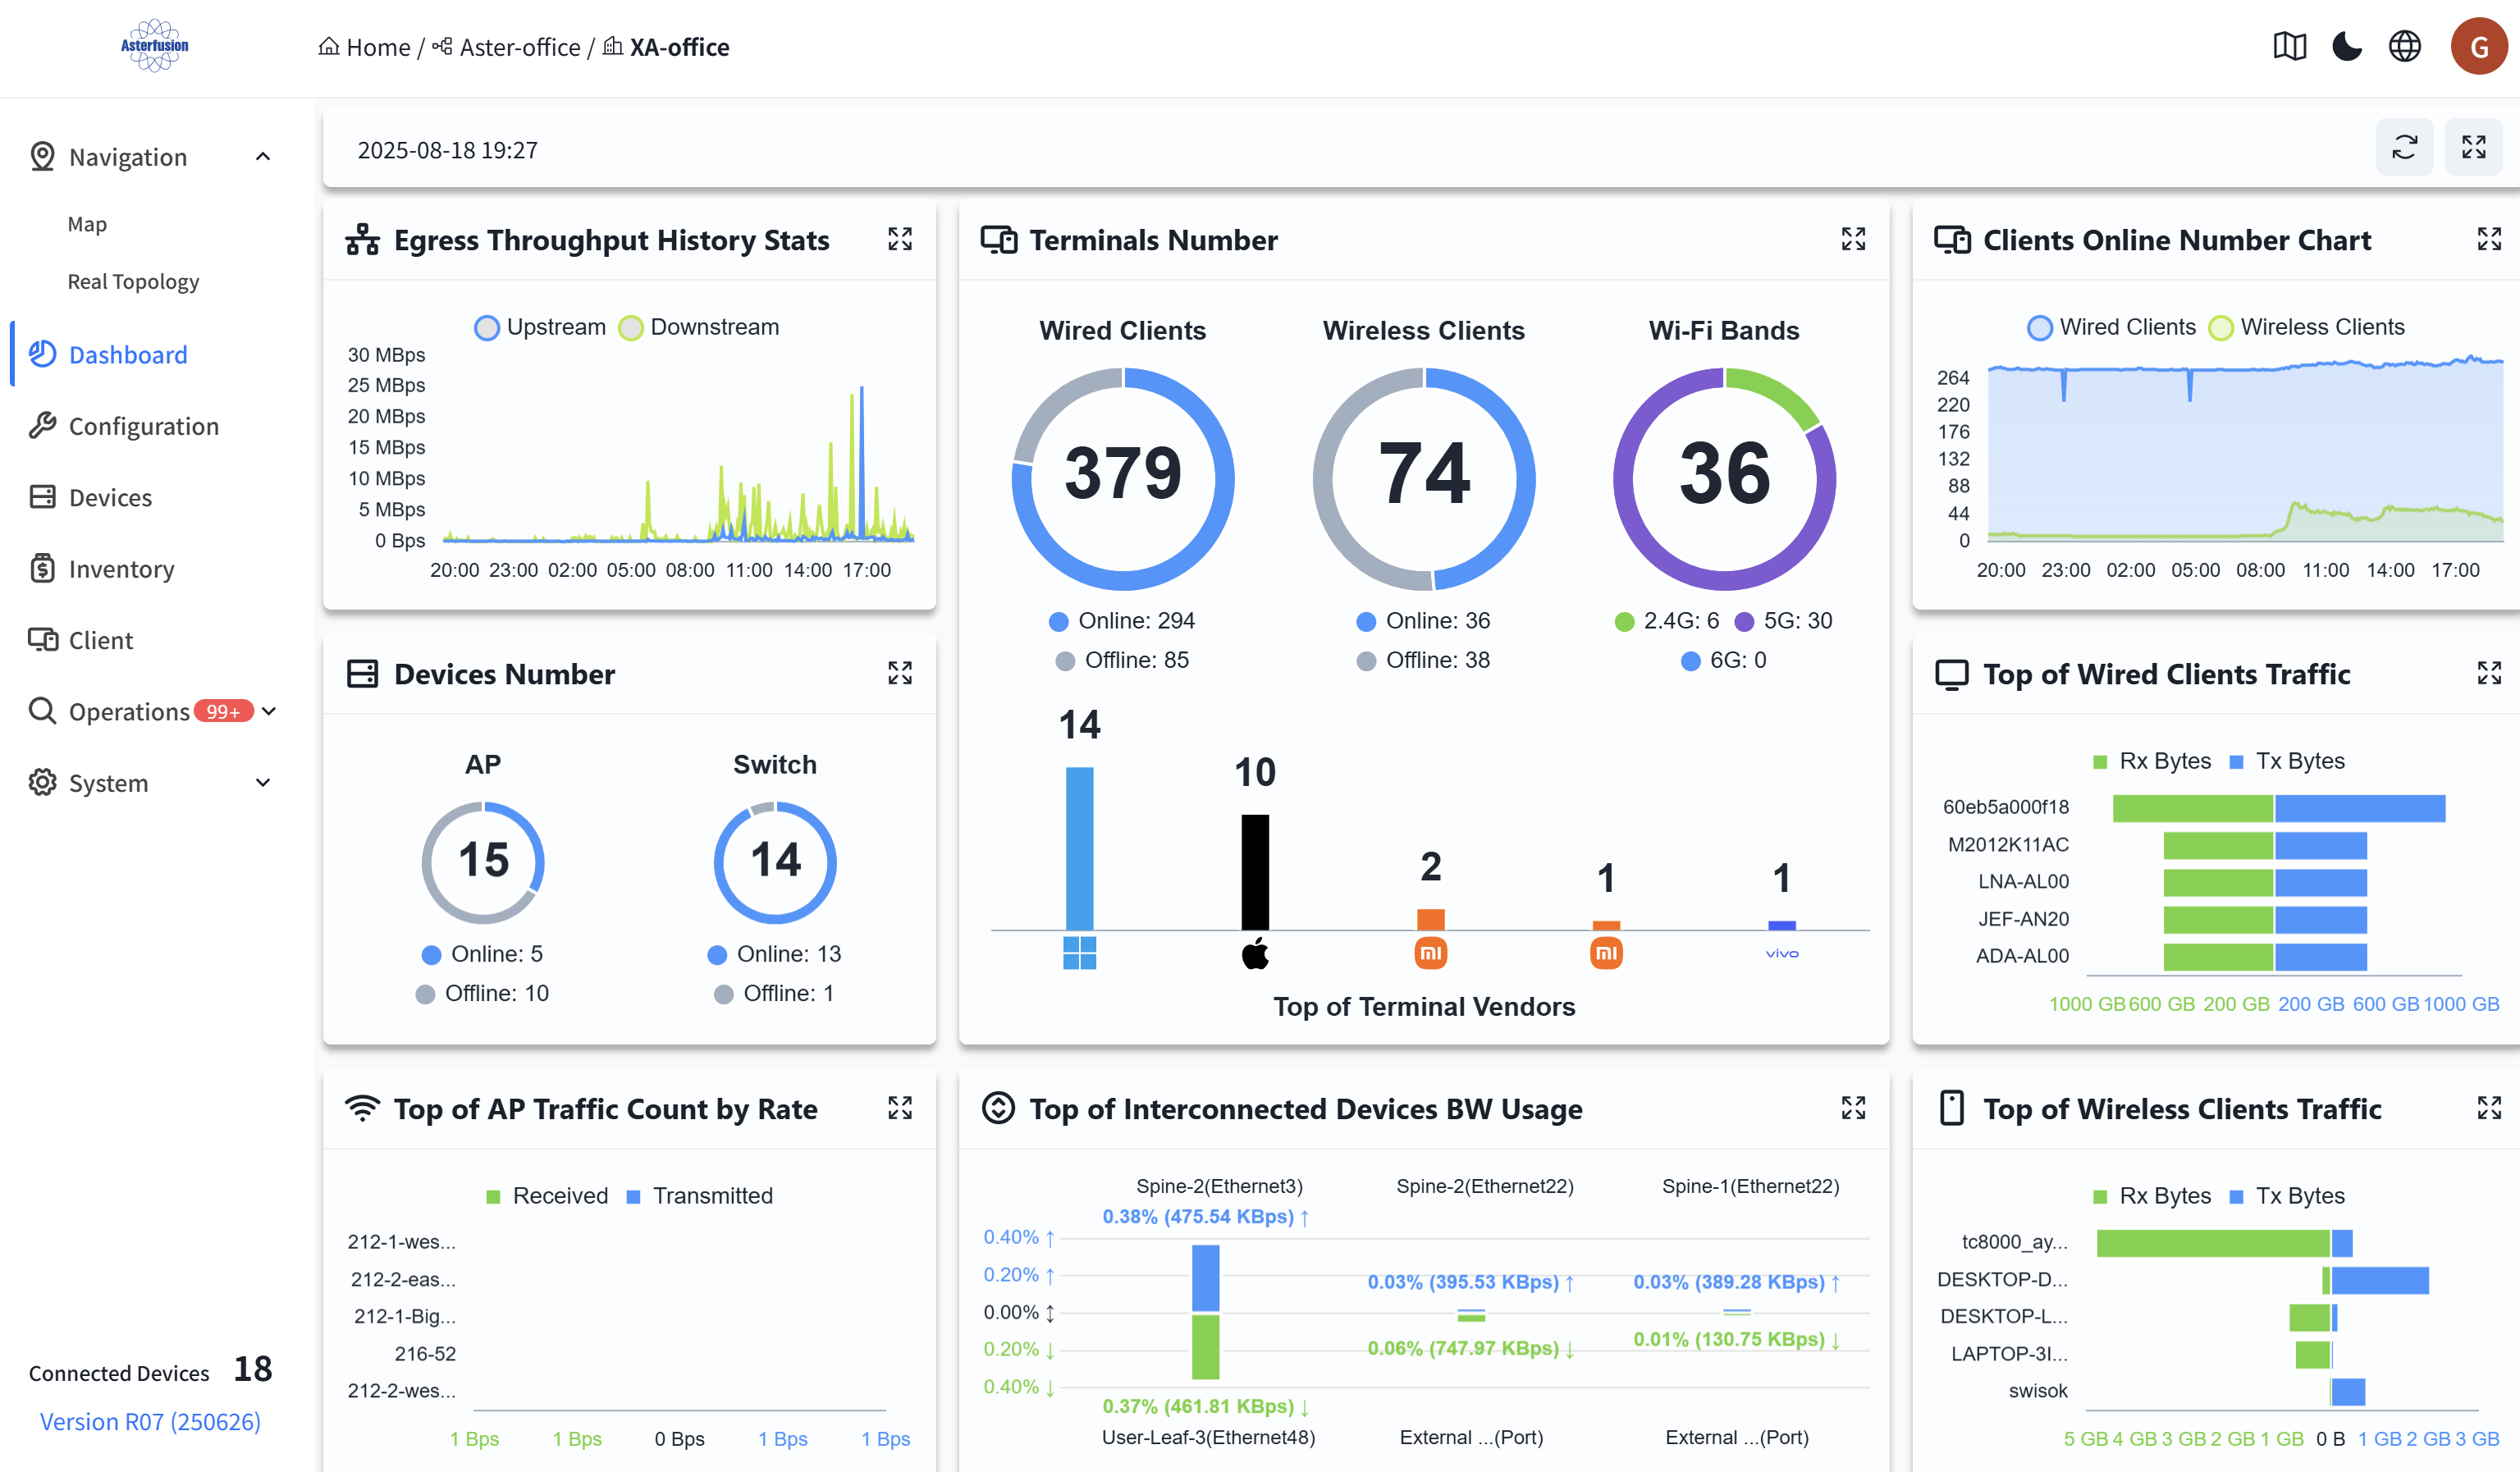
Section titled “Venue Dashboard”Administrators can enter a specific organization on the [Navigation] view to view an overview of the status of devices and terminals under all venues within the organization’s scope, and it supports clicking to jump to the selected terminal. Users can adjust the display cards according to their own preferences.
-
Historical Statistics of Egress Throughput
Displays historical throughput statistics of the Spine up-link ports in this venue.
-
Device Quantity
Displays the online status and quantity of all devices in this venue.
-
Terminal Quantity
Displays the quantity of wired and wireless terminals in this venue; the number of terminals under each wireless radio frequency; and terminal manufacturer information.
-
Terminal Online Trend Chart
Displays the online quantity trend of wired and wireless terminals in this venue over a period of time.
-
Top Cumulative Data Traffic of Wired Terminals
Displays the top 5 cumulative data traffic of wired terminals in this venue over a period of time.
-
Top Cumulative Data Traffic of Wireless Terminals
Displays the top 5 cumulative data traffic of wireless terminals in this venue over a period of time.
-
Top Statistical Report of AP Uplink Port Traffic Rate
Displays the real-time top 5 AP uplink port traffic rates in this venue.
-
Top Bandwidth Utilization Rate of Interconnected Devices
Displays the top 5 bandwidth utilization rates of interconnection links between Spine and Leaf devices in this venue.
Terminal Status Visualization
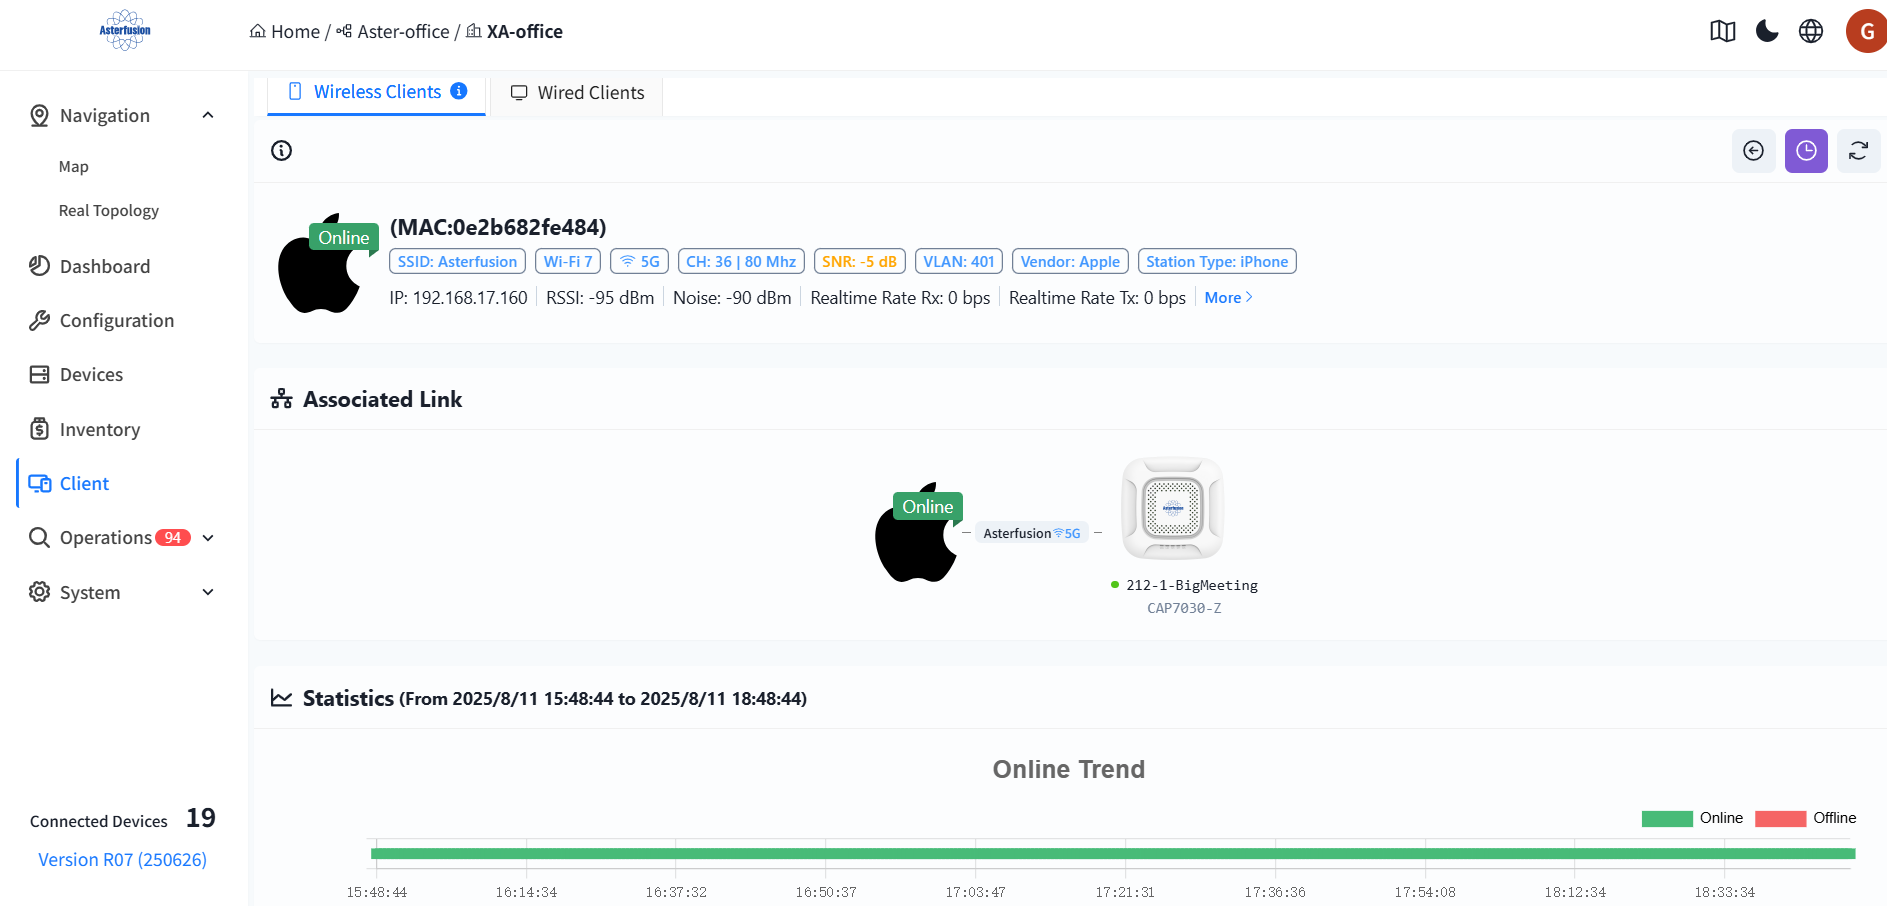
Section titled “Terminal Status Visualization”The controller supports collecting data of wired and wireless terminals online and visually presenting the status of online users. After entering a specified organization/venue, administrators can click [Client] to view information of all terminals under the organization/venue.
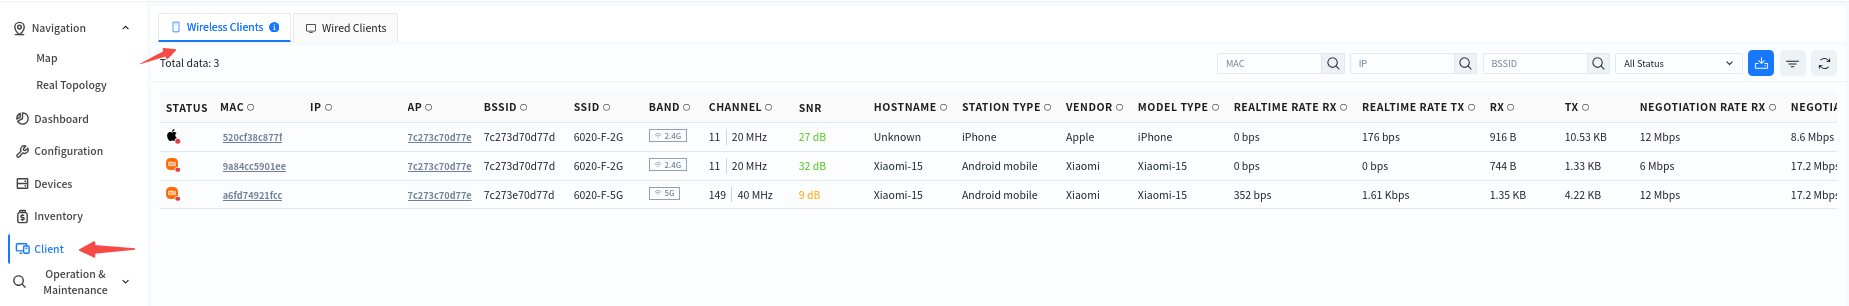
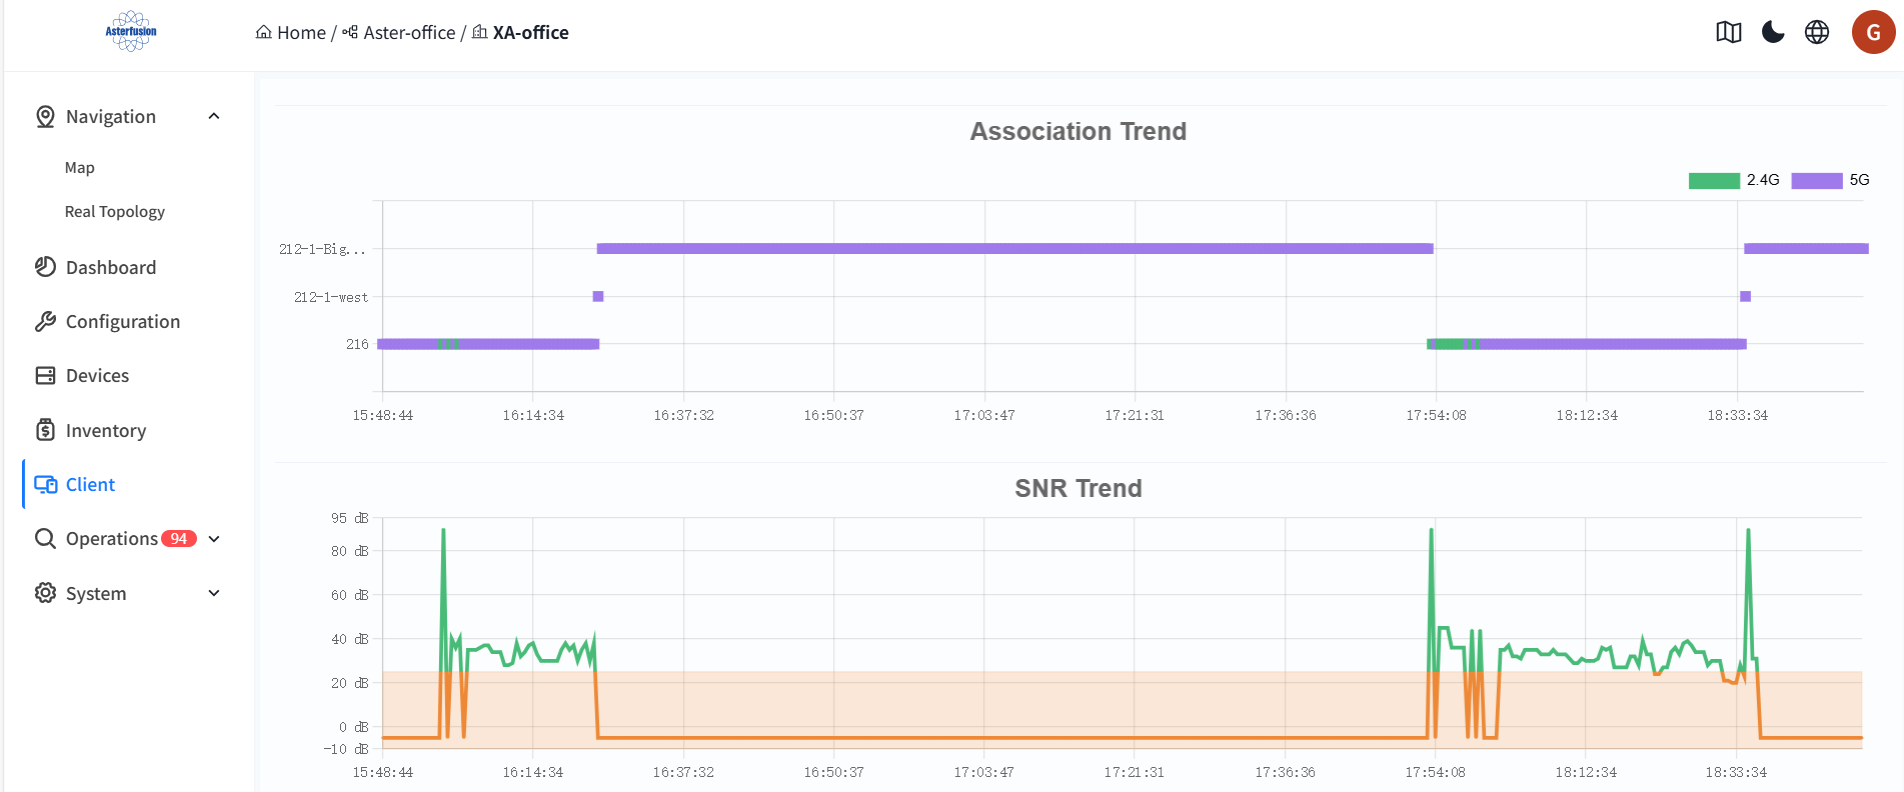
Click on the MAC address of the terminal to enter the detailed view and view detailed data such as the online trend, associated AP trend, SNR trend, and traffic statistics of the terminal. This helps administrators analyze the network connection status of the terminal within a specific time frame.
-
SNR Trend
The SNR (Signal-to-Noise Ratio) trend of the terminal is a key dynamic indicator for measuring the quality of the wireless communication link. The baseline value is 25dB. A value lower than this indicates poor signal quality.
-
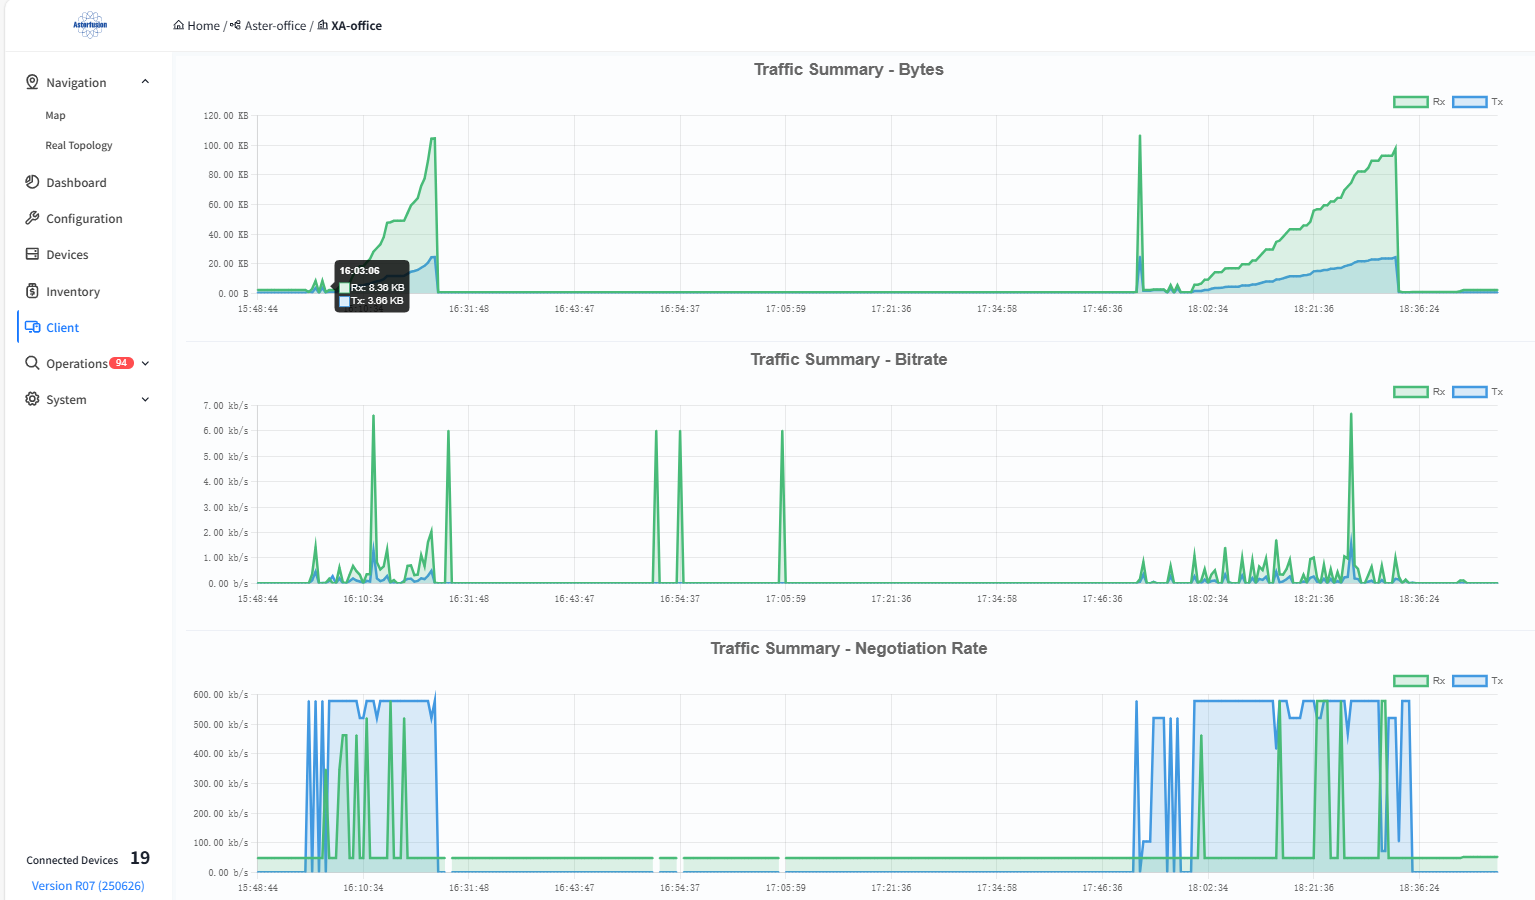
Traffic Statistics
Rx represents the amount of data received from the network or other devices, and Tx represents the amount of data sent from the device to the network or other devices.
Device status visualization
Section titled “Device status visualization”Click [Device] - [Device MAC] to enter the management interface of the specified device and view the detailed information of this device:
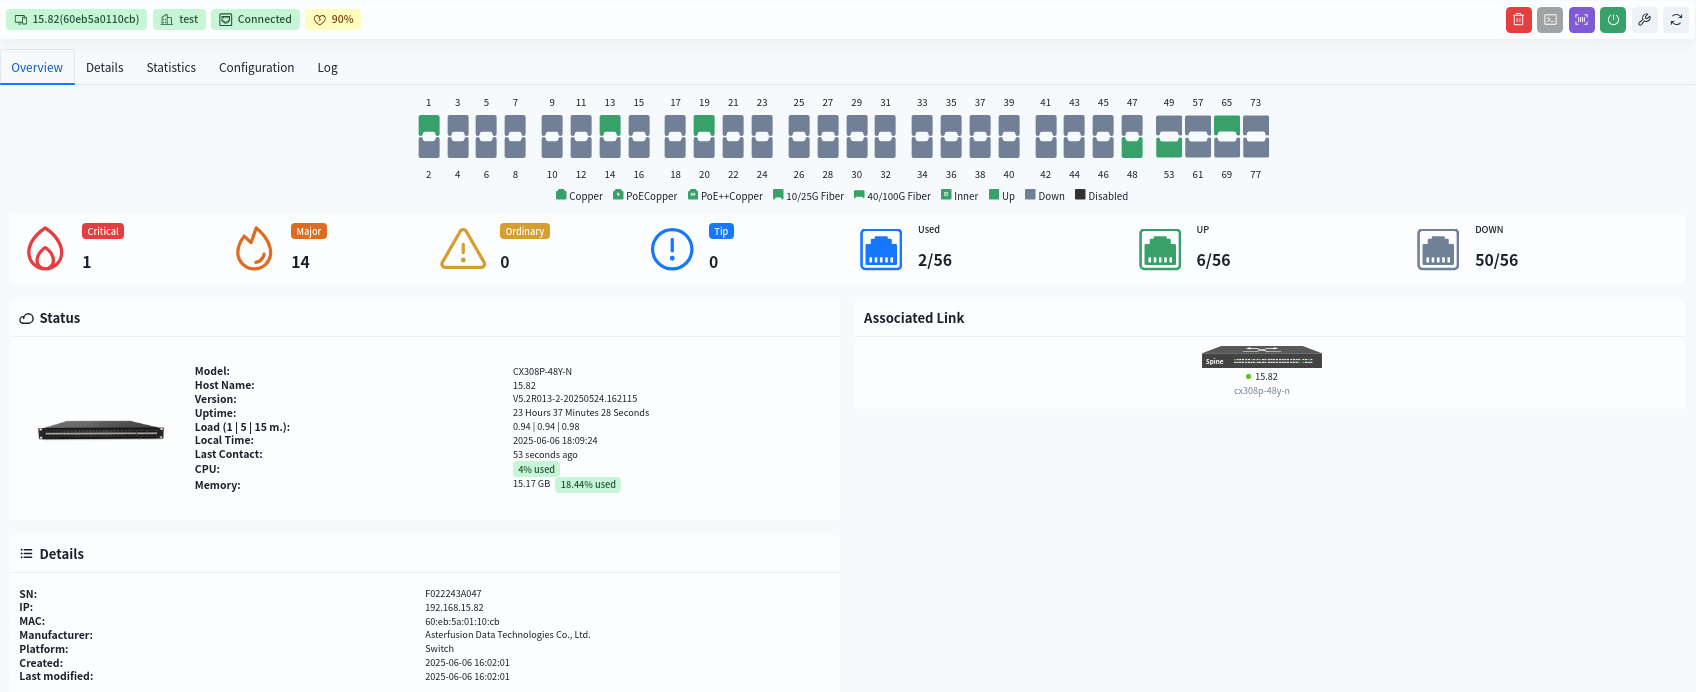
Overview of device information
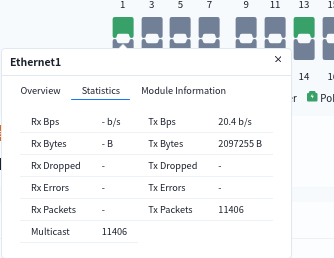
Section titled “Overview of device information”View interface information
- View interface statistics
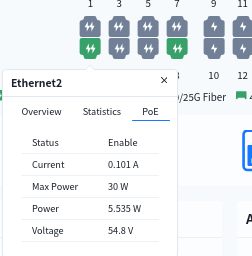
- view interface PoE power supply situation
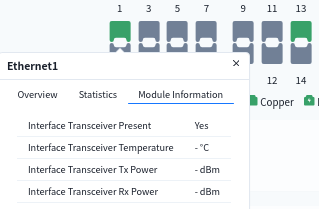
- View interface optical module information
-
Device status:
Users can view device model, hostname, CPU usage, memory usage, and other information here.
-
Detailed information:
Including device SN code, MAC address, manufacturer, and other information.
-
Associated link:
Display the devices associated with this device, click on the name of the associated device to jump to the status visualization interface of a single device.
View device details
Section titled “View device details”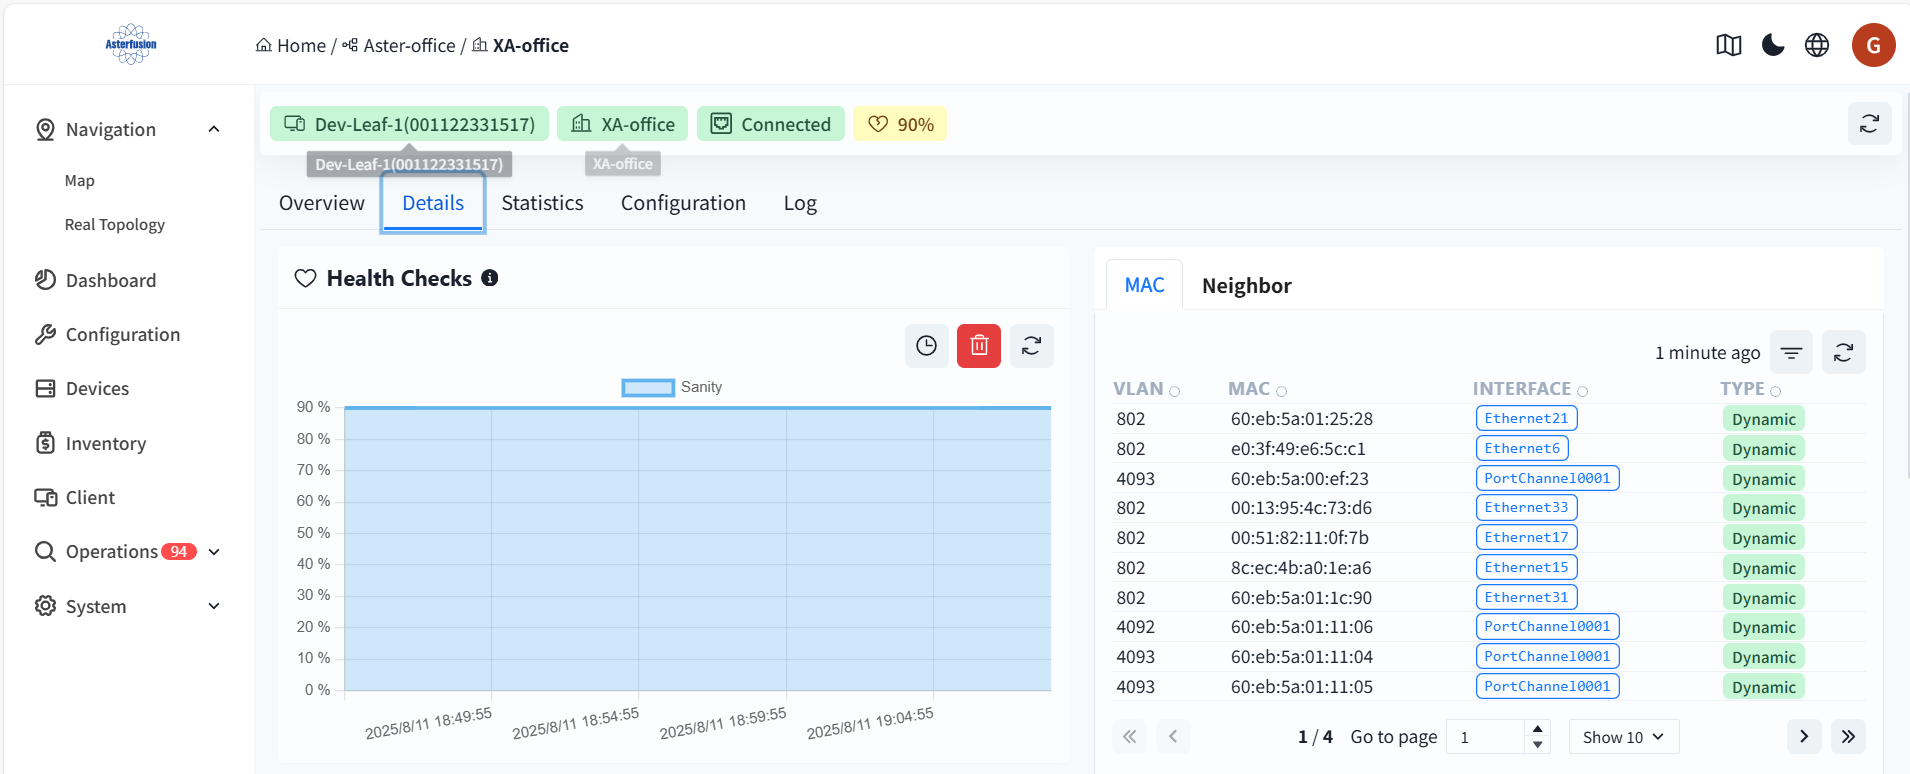
Health Checks
The initial health check value for both the switch and the AP is 100%.
- Health check calculation specification for the switch: CPU utilization over 80%, soundness reduced by 10% Memory utilization over 80%, soundness reduced by 10% Switch chip/CPU temperature over 85°C, soundness reduced by 10% PSU any one power supply status abnormality (power module not in position, power supply not powered), soundness minus 10% Service detection: any critical business service abnormality, soundness minus 10%
- AP Health Check Calculation Rule: interface can successfully detect the DHCP/DNS server information is normal interface, integrity = normal interface/total number of interfaces.
MAC
The MAC address table (CAM table) of the switch records the mapping relationships between the MAC addresses learned by the switch, ports, and VLANs.
- VLAN: The VLAN ID to which the MAC address belongs, used to identify different broadcast domains.
- MAC: The learned device MAC address (source MAC address).
- Interface: The switch port corresponding to the MAC address (EthernetXX: Physical port, PortChannelXXXX: Link aggregation group).
- Type: Item generation method (Dynamic: Automatically learned by monitoring data frames; Static: Manually configured by the administrator)。
- Neighbor information (ARP)
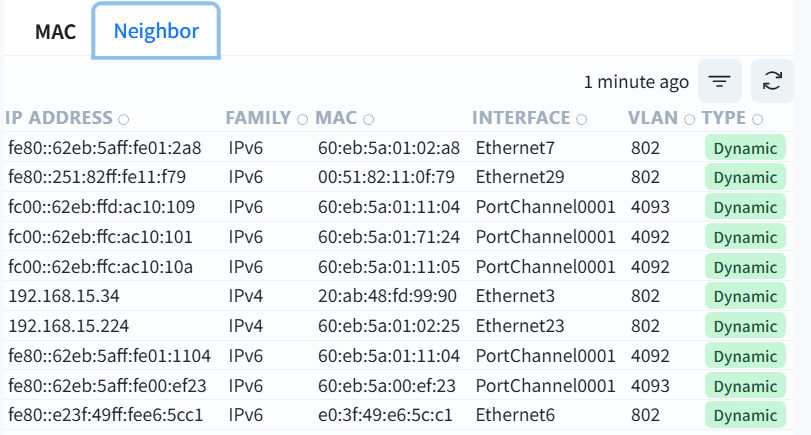
This table is the neighbor discovery table of the switch (NDP for IPv6/ARP for IPv4), which records the IP-MAC mapping relationship of devices directly connected to the local switch.
- IP address: IP address (IPv4/IPv6) of the neighbor device
- Family: IPv4 or IPv6 protocol type
- MAC: The physical address of the neighbor device
- Interface: The port of the local switch connected to this neighbor
- VLAN: The virtual local area network where the communication takes place
- Type: Dynamic (automatic protocol learning) or Static (manual configuration)
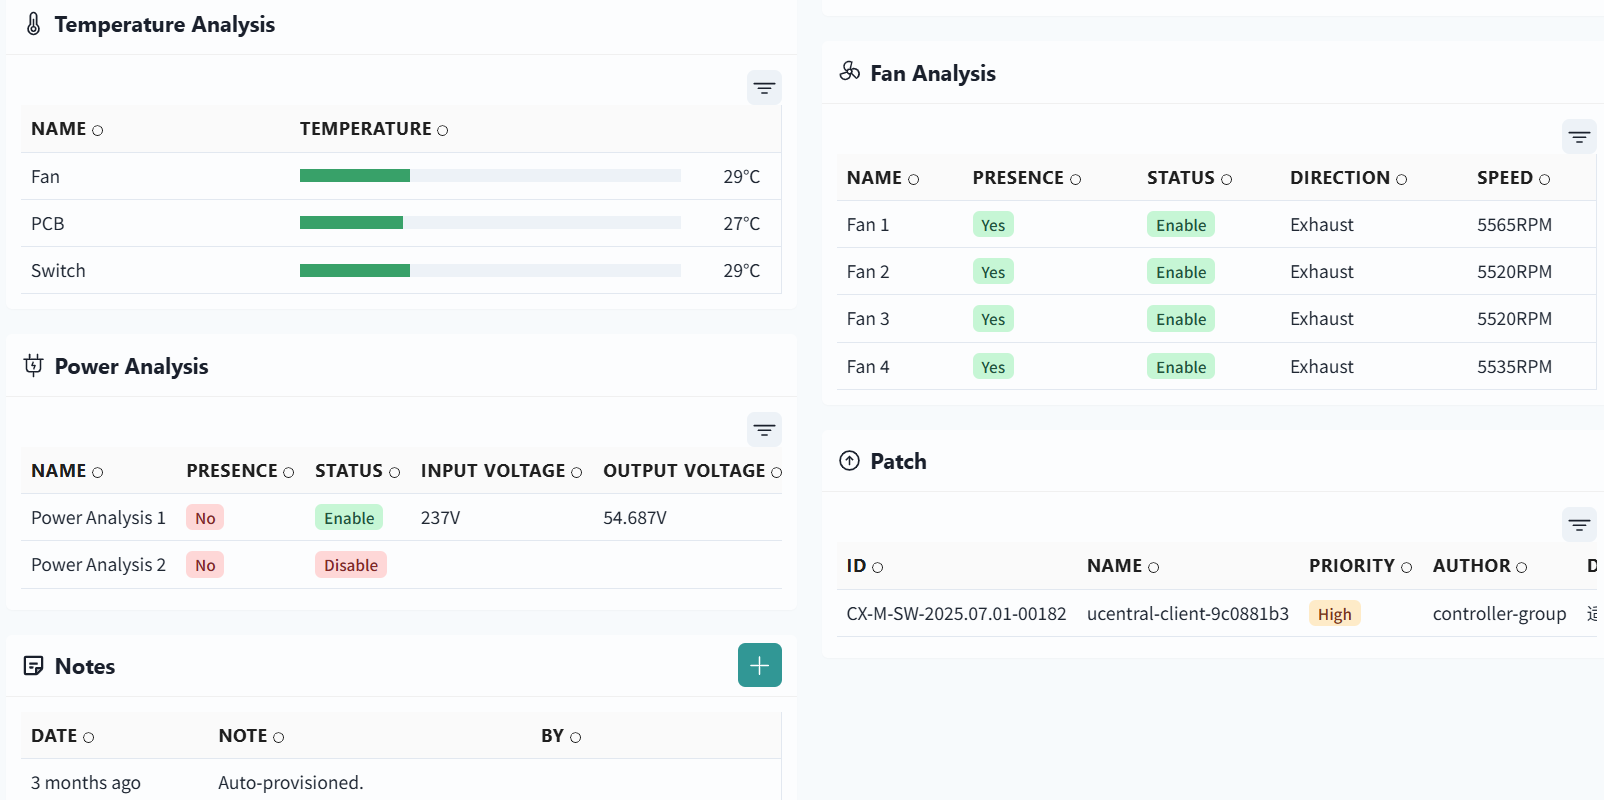
-
Temperature Analysis
Display the temperature information of each component of the display device
-
Fan Analysis
Display detailed information of each fan module of the display device
-
Power Analysis
Display device power information
-
Patches
List of patches already installed on the device
-
Notes
Remarks information added by the user
View device statistics
Section titled “View device statistics”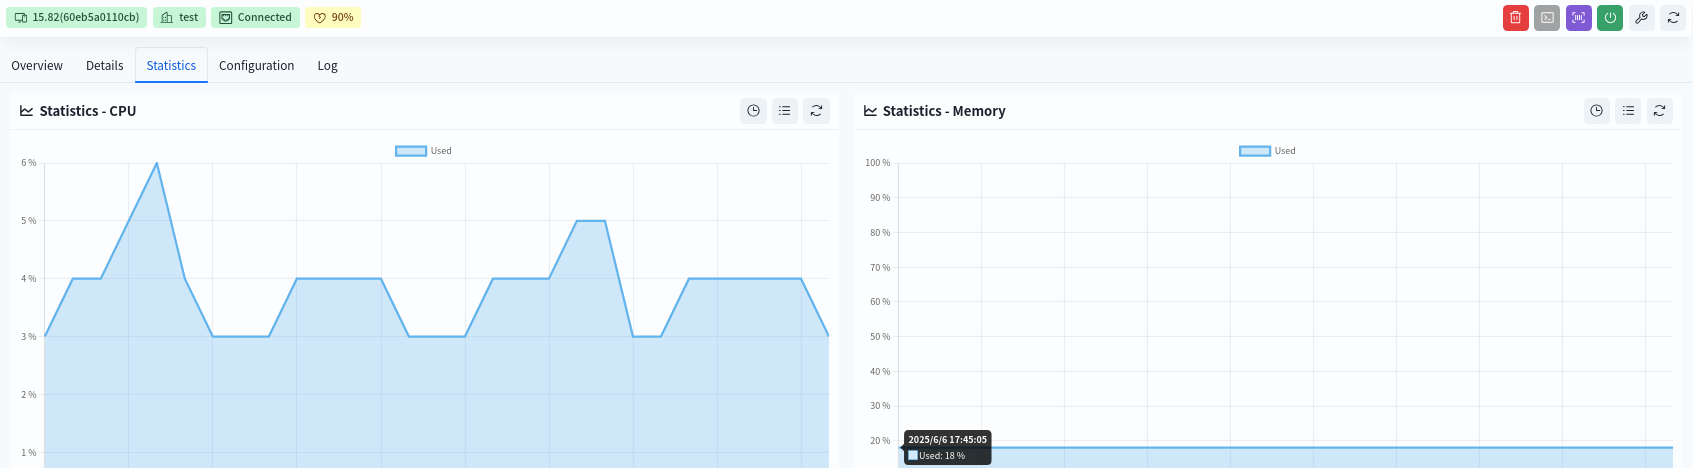
- CPU Statistics Historical CPU statistics over a three-day period.
- Memory Statistics Historical memory statistics over a three-day period.
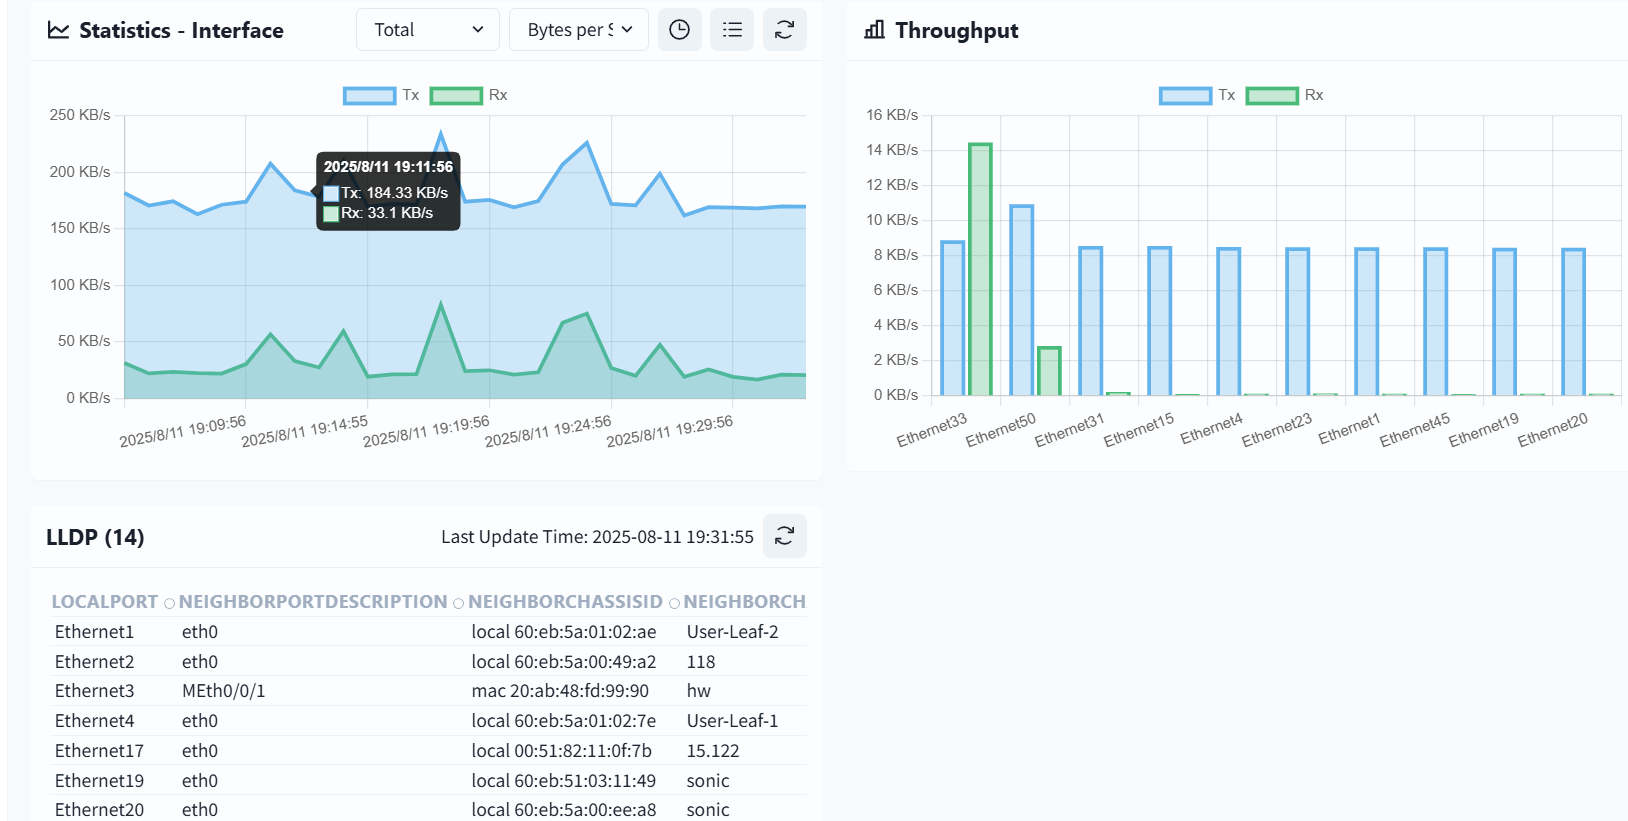
- Statistics - Interface Statistics of single interface/whole machine interface support two statistical methods: byte rate (bytes per second) and the number of data packets (increment from the previous counting moment).
- LLDP Display LLDP information on the switch.
View device configuration information
Section titled “View device configuration information”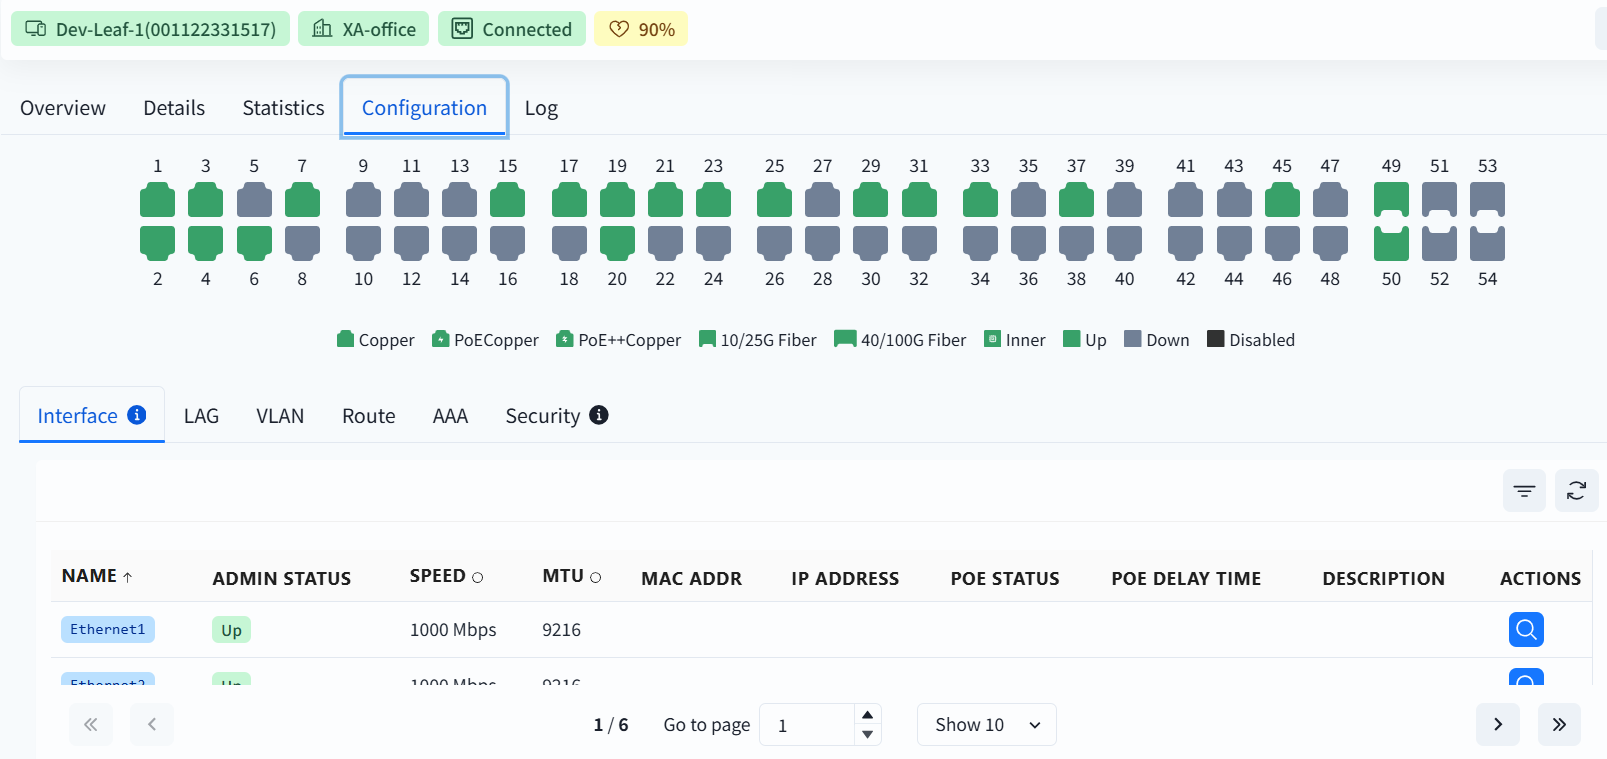
Display the configuration information of device interfaces, LAG, VLAN, routing, authentication, and security.
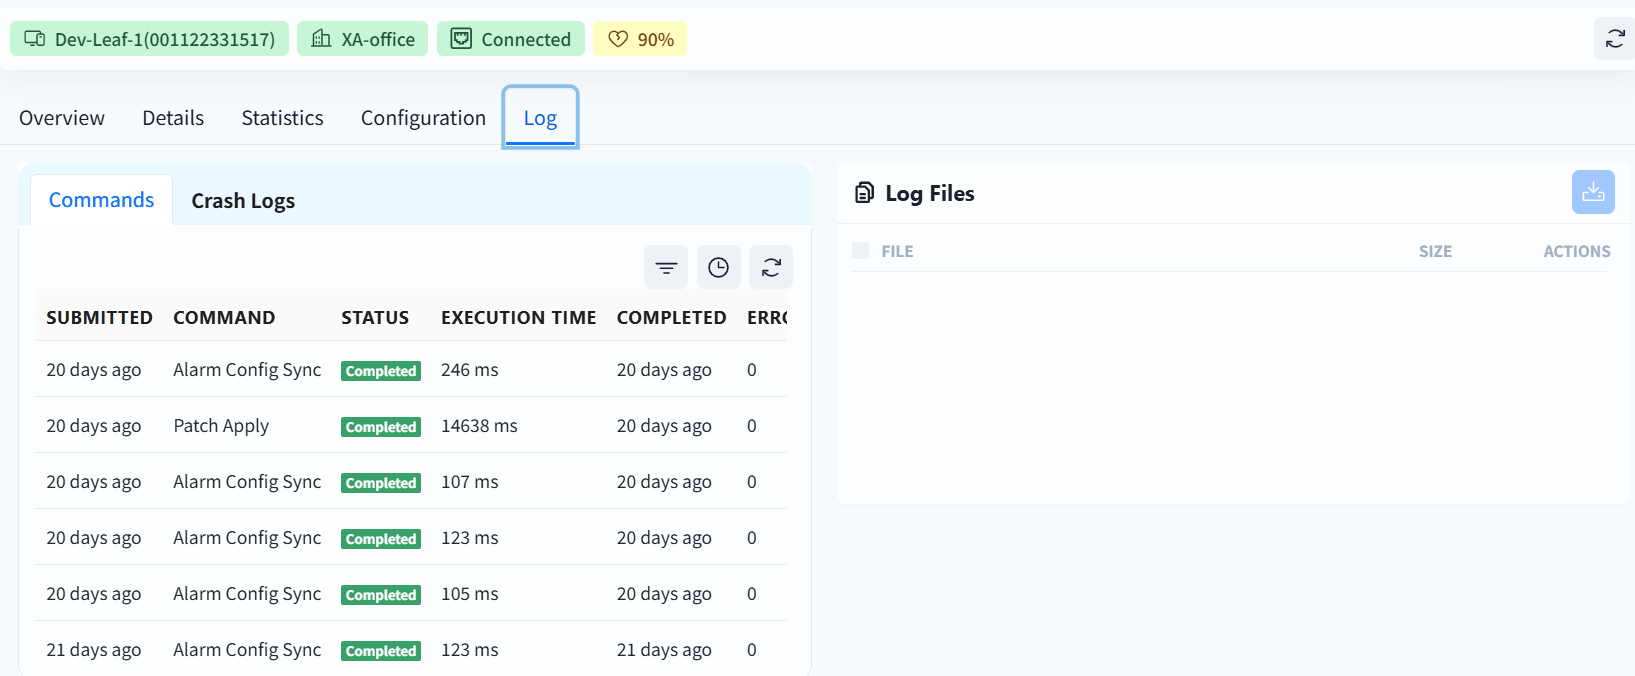
View device log information
Section titled “View device log information”