
Exporter Configuration Guide
此内容尚不支持你的语言。
This document provides a detailed guide on deploying and configuring the AsterNOS Exporter for visual monitoring.
Target Audience
Section titled “Target Audience”This manual is primarily intended for the following engineers:
- Solution planners and implementers
- Network administrators responsible for configuration and maintenance
- Test personnel
Relevant personnel should possess the following competencies:
- Familiarity with Asterfusion PacketBroker network switch products
- Understanding of fundamental computer networking principles
Applicable Hardware Models
Section titled “Applicable Hardware Models”Standard Products
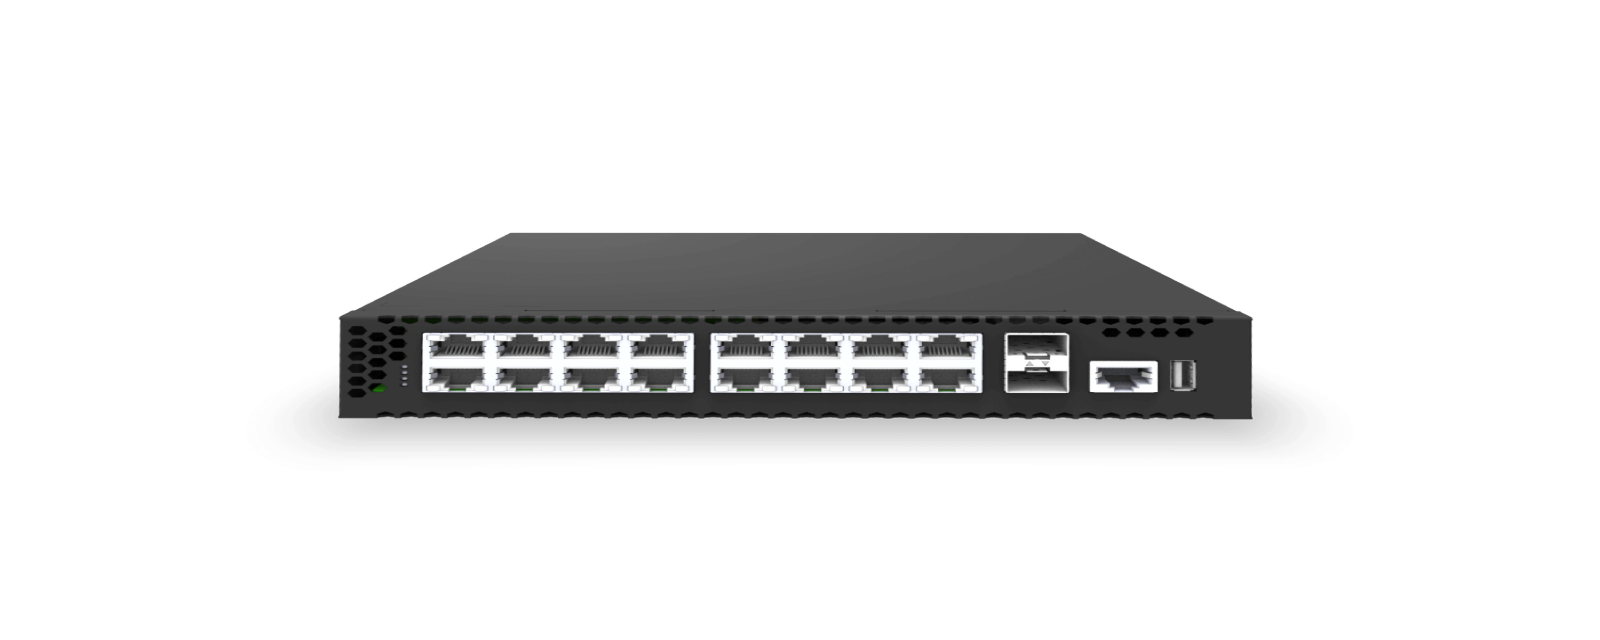
Section titled “Standard Products”16x1G RJ45 PoE+@150W 3 Access Switch, 2x10Gb SFP+ Uplinks, Enterprise SONiC Distribution
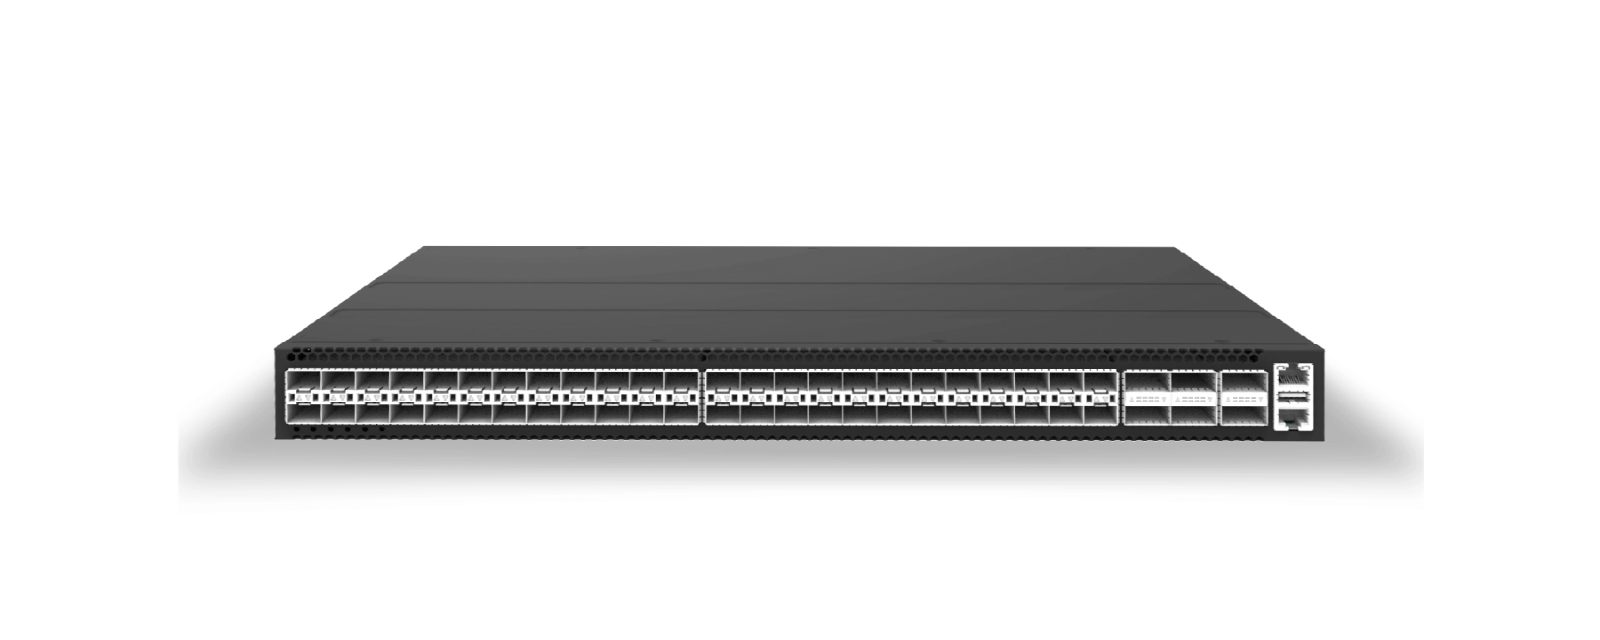
24 x 25Gb SFP28/ 10Gb SFP+, 2x 100Gb QSFP28 Uplinks, L3 Core/Leaf Switch, Marvell Aldrin3 Chip
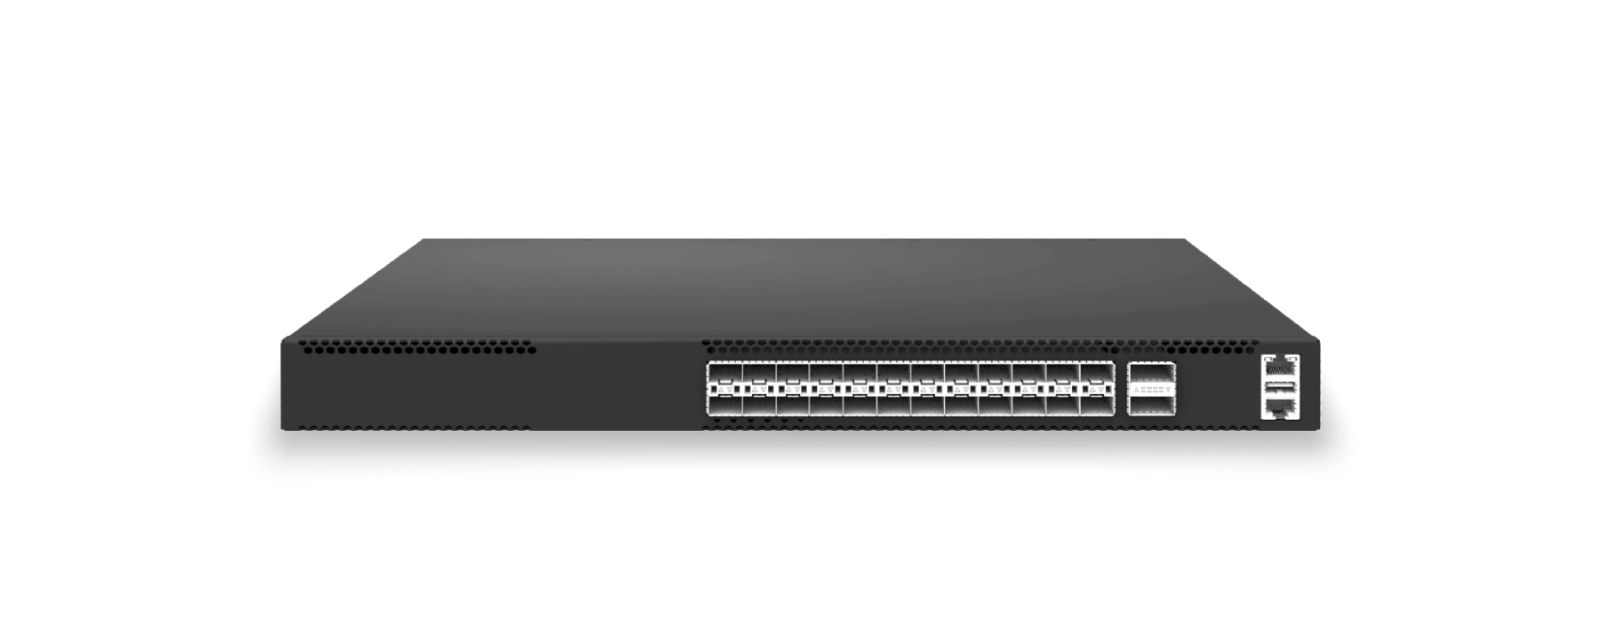
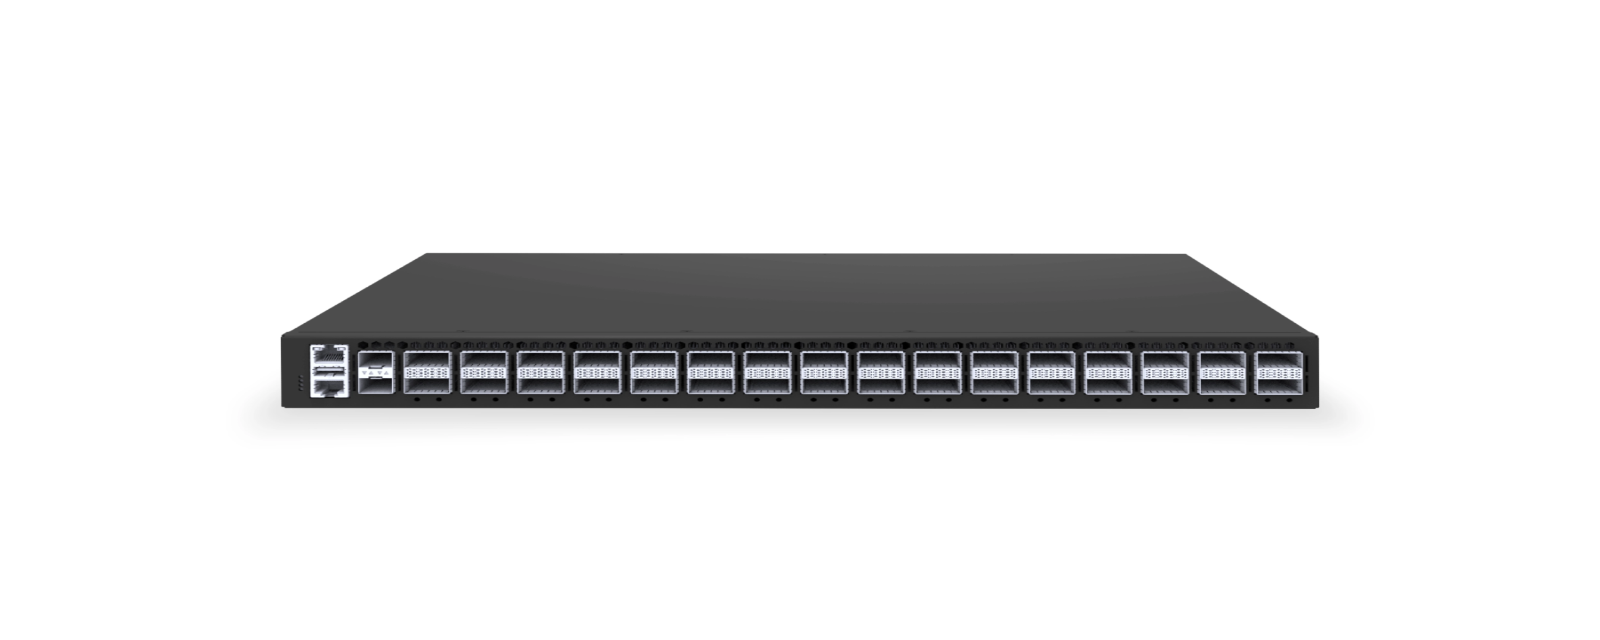
24x10G SFP+ L3 Leaf & Core switch, 6 x 100G QSFP28 /40G QSFP+ Uplinks, SONiC NOS, Marvell Prestera Aldrin2 Chip
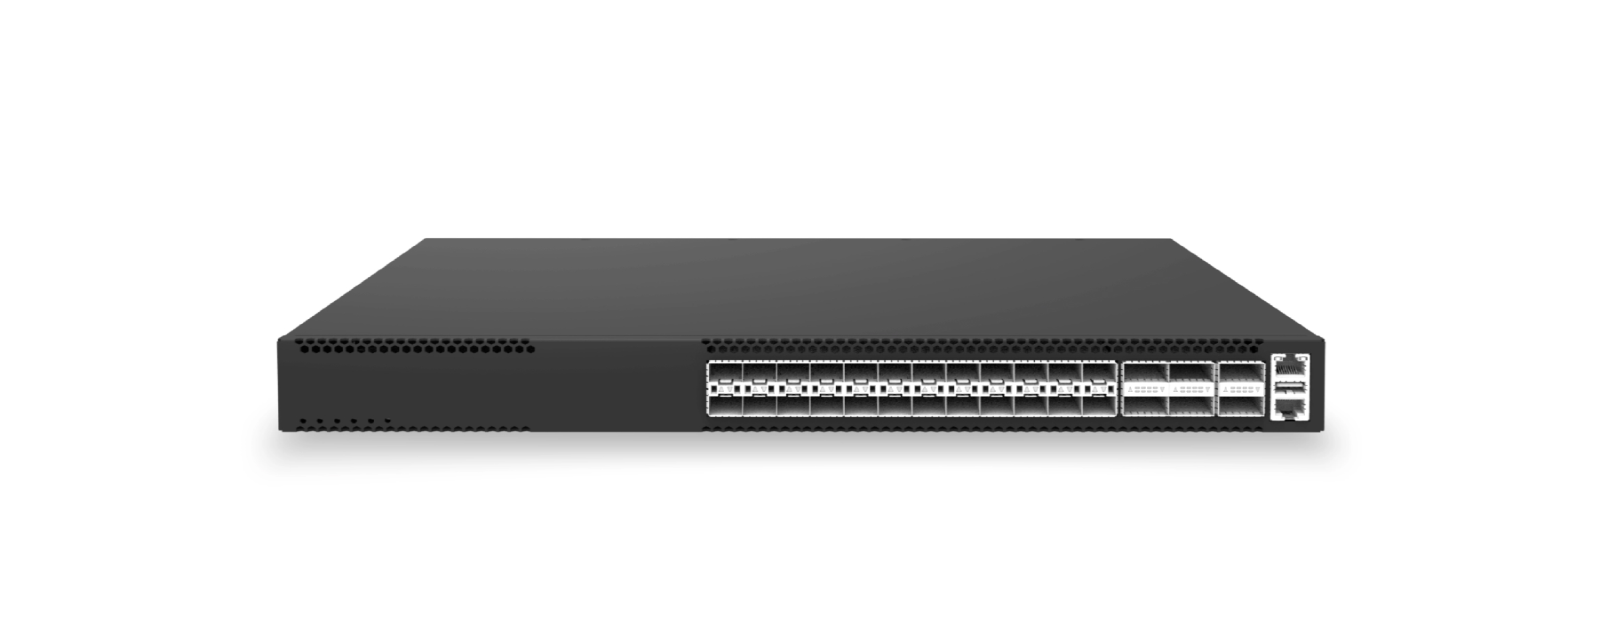
48x 10Gb SFP+, 6x 100Gb QSFP28/40Gb QSFP+ L3 Leaf Core Switch, Enterprise SONiC, Marvell Prestera Aldrin2 Chip
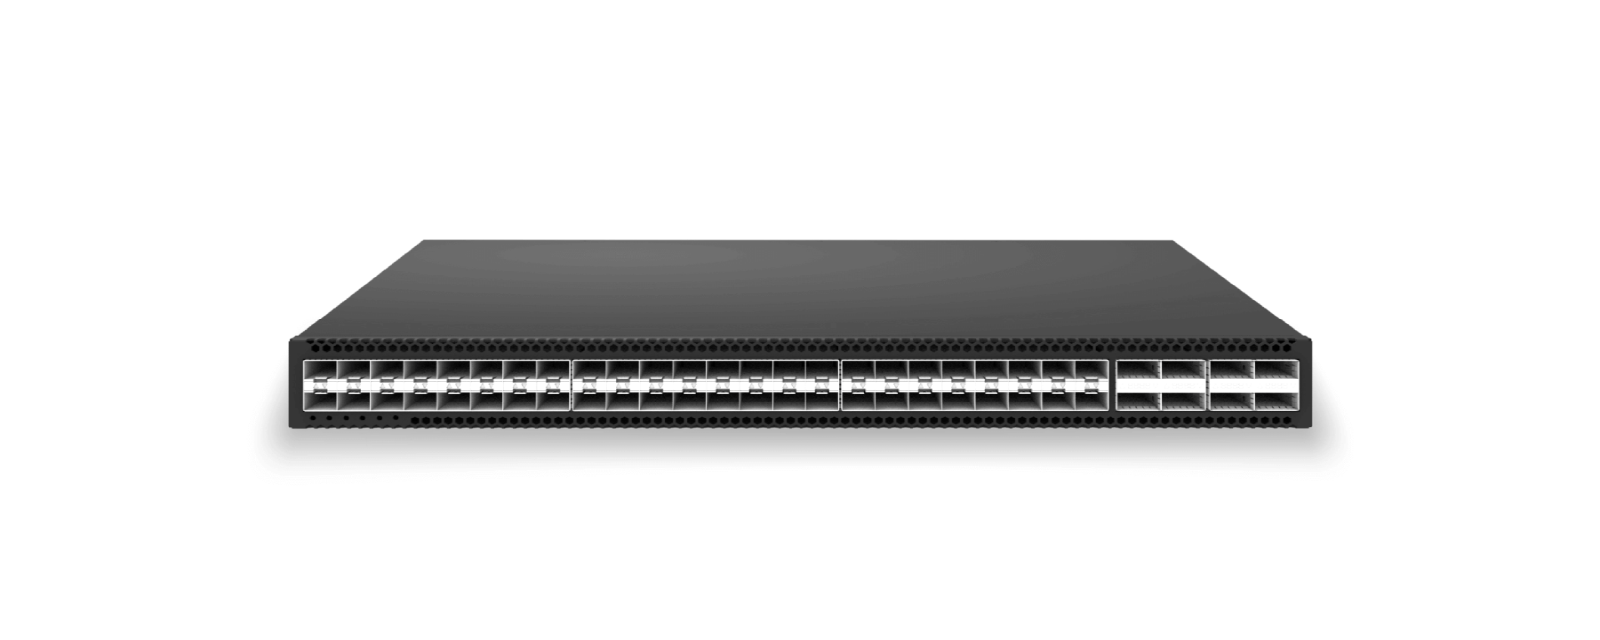
48-port 25Gb SFP28 Switch with 6x100G Uplink, Enterprise SONiC, Marvell Falcon + OCTEON 10 CN103
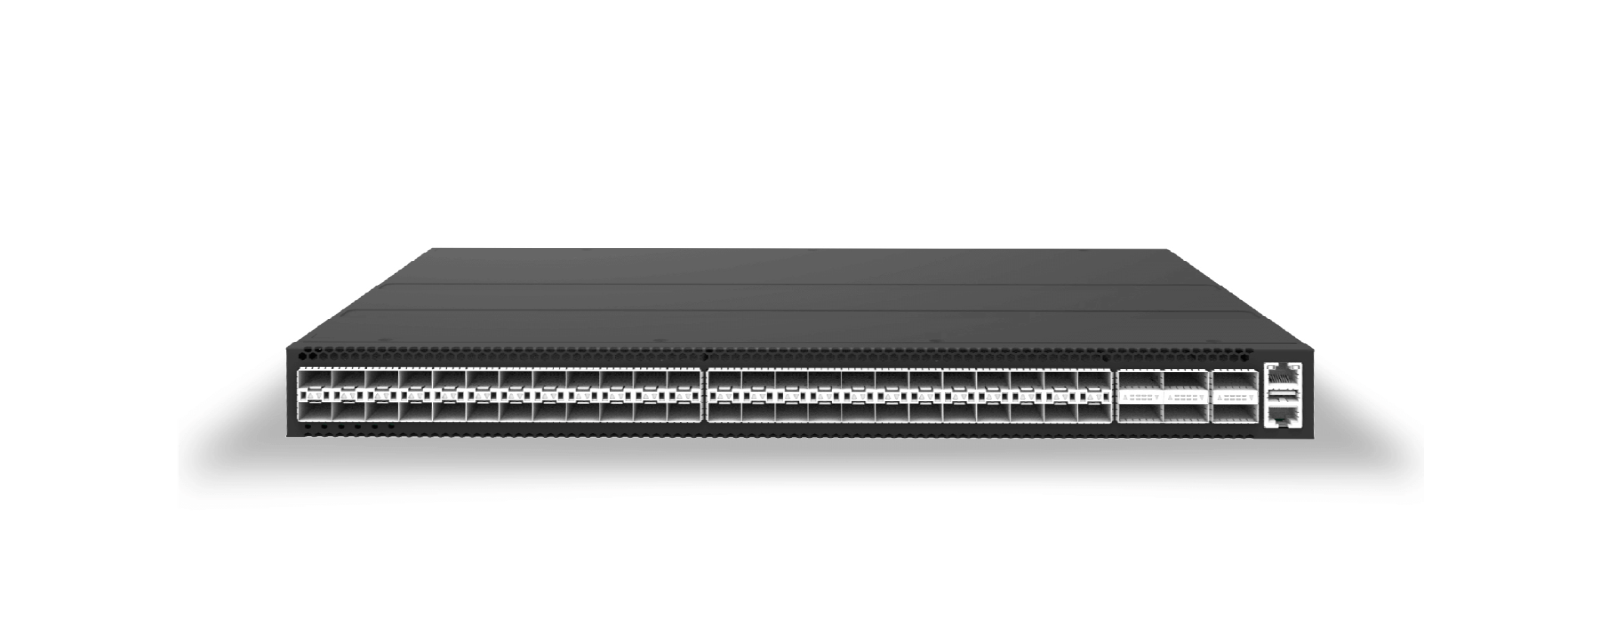
48x25Gb SFP28, 8x100Gb QSFP28 L3 Core/Spine Switch, Enterprise SONiC Ready, Marvell Falcon
32x100Gb QSFP28 Spine and Core Switch Enterprise SONiC Ready Marvell Falcon
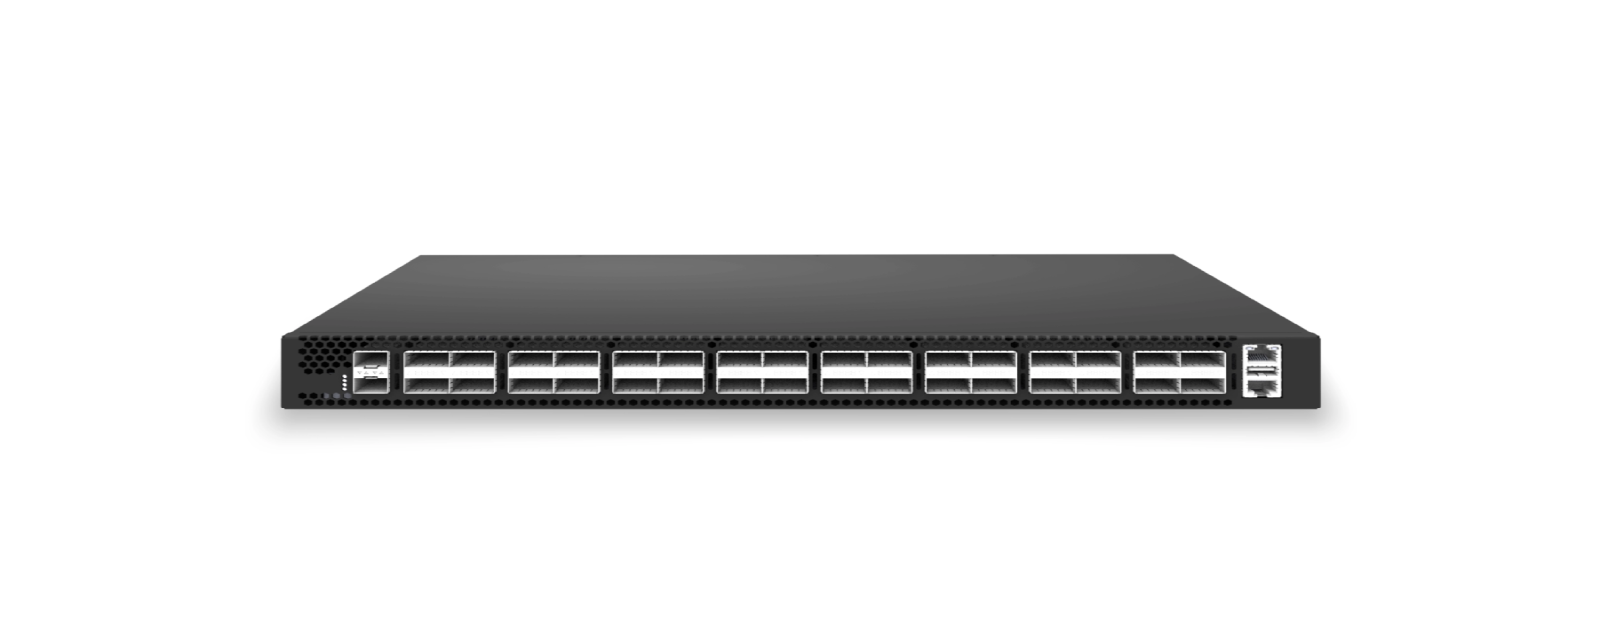
32-port 400 GbE QSFP-DD L3 Spine/Core Switch, Enterprise SONiC Ready, Marvell Falcon
Environment Deployment
Section titled “Environment Deployment”To use AsterNOS Exporter’s visualization features for the first time, you must first enable the exporter feature on the switch to provide external APIs. Then install Prometheus on the monitoring server to collect data, with Grafana displaying the collected data.
Enabling Exporter on the Switch
Section titled “Enabling Exporter on the Switch”- Enable Exporter on the switch requiring monitoring.
sonic# configure terminalsonic(config)# exporter enable- Save configuration
sonic(config)# exitsonic# writesave running-config...Existing files will be overwritten, continue? [y/N]: yRunning command: /usr/local/bin/sonic-cfggen -d --print-data > /etc/sonic/config_db.jsonDeploying Prometheus on the Server
Section titled “Deploying Prometheus on the Server”Prometheus Official Website:https://prometheus.io/docs/prometheus/latest/installation/
This section uses Rocky Linux 9.6 (Blue Onyx) running on a virtual machine as an example, with Docker components already pre-installed.
- Edit daemon.json to update Docker sources
vi /etc/docker/daemon.json- Edit source information (optional). If the original source can pull the Prometheus image, there is no need to update the source.
{"registry-mirrors": ["https://w14ki3ju.mirror.aliyuncs.com","http://hub-mirror.c.163.com","https://registry.docker-cn.com","https://docker.m.daocloud.io"]}- Restart Docker to load the updated sources.
systemctl daemon-reloadsystemctl restart docker- Pull the Prometheus image
docker pull prom/prometheus- Create a Prometheus configuration file (to be mounted into the Docker container during creation) and edit and save it.
vi prometheus.ymlglobal: scrape_interval: 15s # Set the scrape interval to every 15 seconds. Default is every 1 minute.scrape_configs: - job_name: "exporter" static_configs: - targets: ["192.168.1.102:8101", "192.168.1.103:8101", "192.168.1.220:8101", "192.168.1.236:8101"]- Create and run the prom/prometheus Docker container. Name the Docker container prometheus and run it on port 9090. Map the prometheus.yml file in the host’s current directory to /etc/prometheus/prometheus.yml within the Docker container.
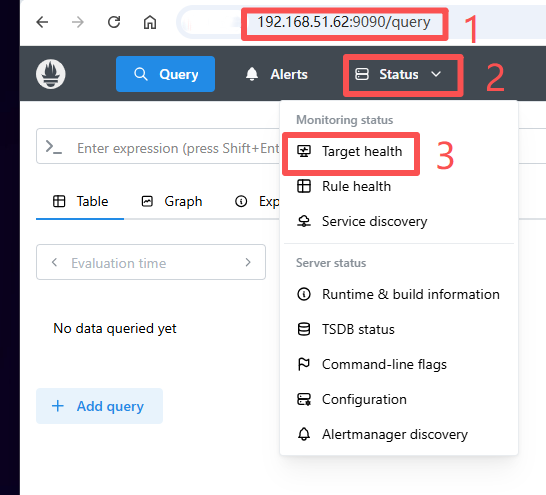
docker run -d --name prometheus -p 9090:9090 -v ~/prometheus.yml:/etc/prometheus/prometheus.yml prom/prometheus- Verify the deployment’s success by logging into the host machine’s IP address plus port 9090 via a browser to check the monitoring information status.

Deploying Grafana on a Server
Section titled “Deploying Grafana on a Server”Grafana Official Website: https://grafana.com/docs/grafana/latest/setup-grafana/
This section uses Rocky Linux 9.6 (Blue Onyx) running on a virtual machine as an example, with Docker components already pre-installed.
- Edit daemon.json to update the Docker repository.
vi /etc/docker/daemon.json- Edit source information (optional). If the original source can pull the Prometheus image, there is no need to update the source.
{"registry-mirrors": ["https://w14ki3ju.mirror.aliyuncs.com","http://hub-mirror.c.163.com","https://registry.docker-cn.com","https://docker.m.daocloud.io"]}- Restart Docker to load the updated sources.
systemctl daemon-reloadsystemctl restart docker- Pull the Grafana image
docker pull grafana/grafana-oss- Create and run a Docker container for grafana/grafana-oss:latest. Name the Docker container grafana and run it on port 3000.
docker run -d --name grafana -p 3000:3000 grafana/grafana-oss:latest- Access the host machine via browser using its IP address plus port 3000. The initial username and password are admin/admin. After the first login, you can update the password.

- Add a Prometheus data source to Grafana
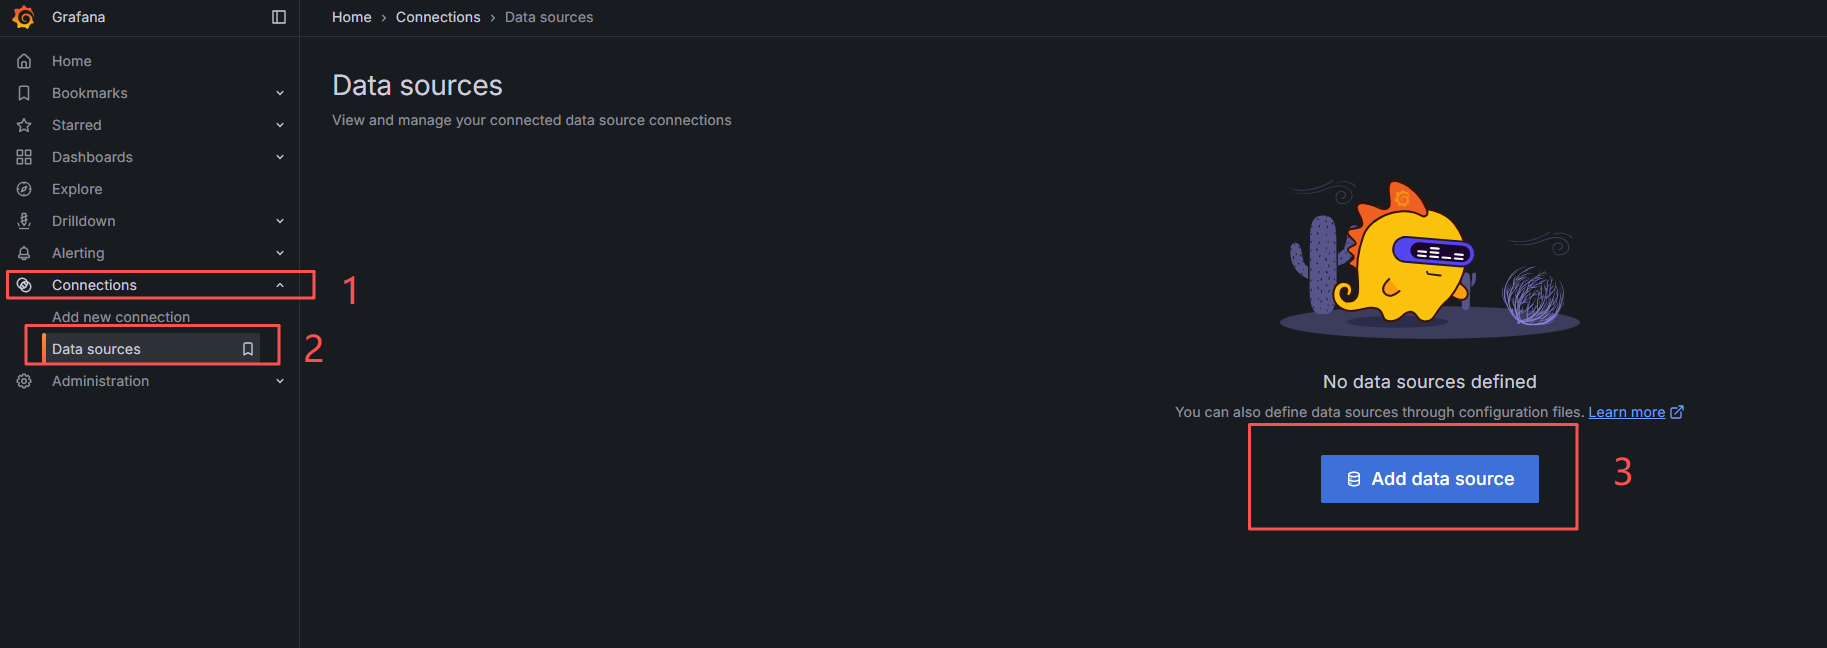


")

Grafana Usage Guide
Section titled “Grafana Usage Guide”We recommend using the Dashboard templates provided by AsterNOS for visual monitoring.
The AsterNOS-Exporter_Dashboard_PB_Vxxx.json template serves as the base monitoring dashboard for tracking device status and related information.
Follow these steps:
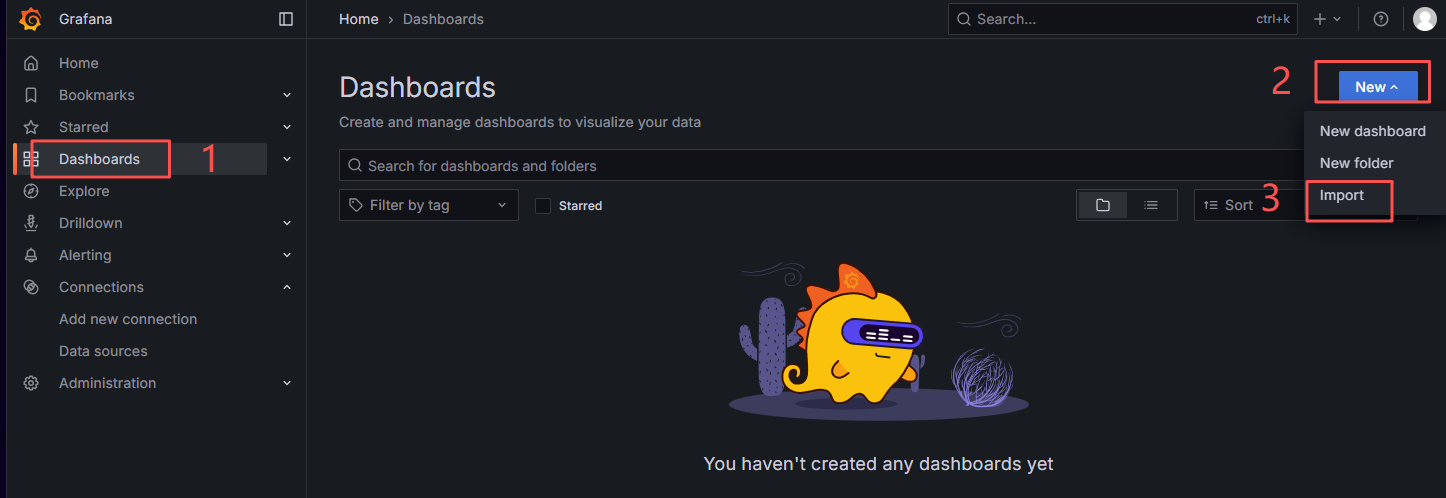
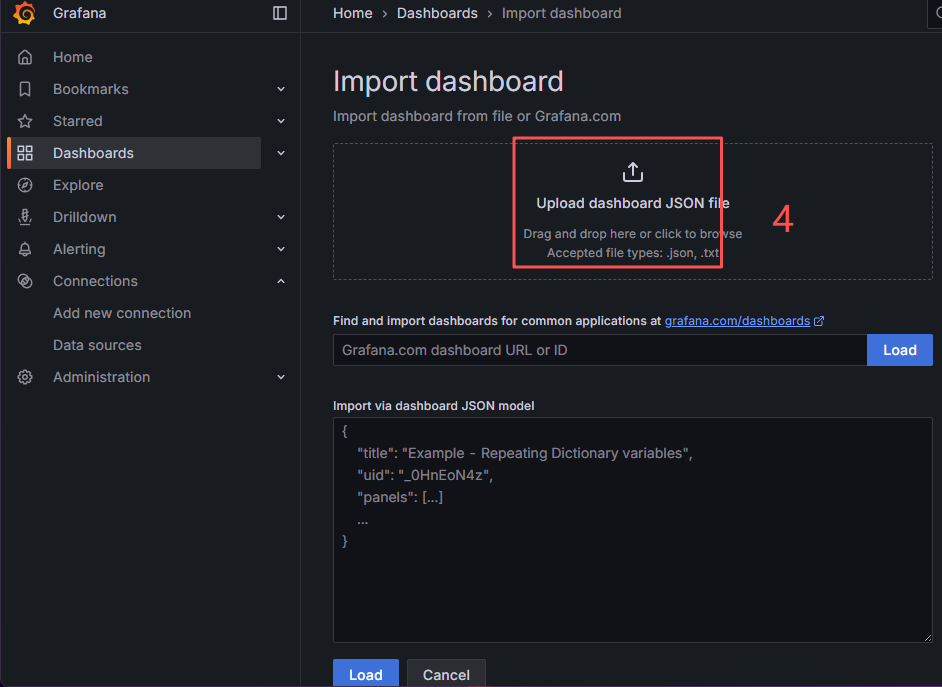
- First, obtain the Dashboard JSON file corresponding to your version from Asterfusion personnel, then import it:

- View Template

3 Select the devices to monitor. At this point, all configuration is complete. You can now monitor the devices in real time via the visualization interface.
