Operation and Alarm Management
Firmware management is an important feature of the controller for managing version image files and patch files for network devices. Users can upload local images to the controller for easy deployment of new software versions throughout the network, or update network devices directly with the uploaded firmware.
Administrators can upload local version images to the controller and record basic information about software versions.
Firmware Upload
Section titled “Firmware Upload”The administrator can upload the local version image to the controller and record the basic information of the software version. Operation steps:
| Procedure | Description |
|---|---|
| Step 1 | Go to [Operation] - [Firmware] - [Firmware]. |
| Step 2 | Click [+] to upload the version image to the controller. |
| Step 3 | Use [Type] to distinguish whether the firmware applies to the switch or the AP. |
| Step 4 | Use [Platform] to specify different hardware models. |
| a) ARM64: CX102 series, CX202 series, CX204 series and CX206 series. | |
b) X86: CX308 series, CX532 series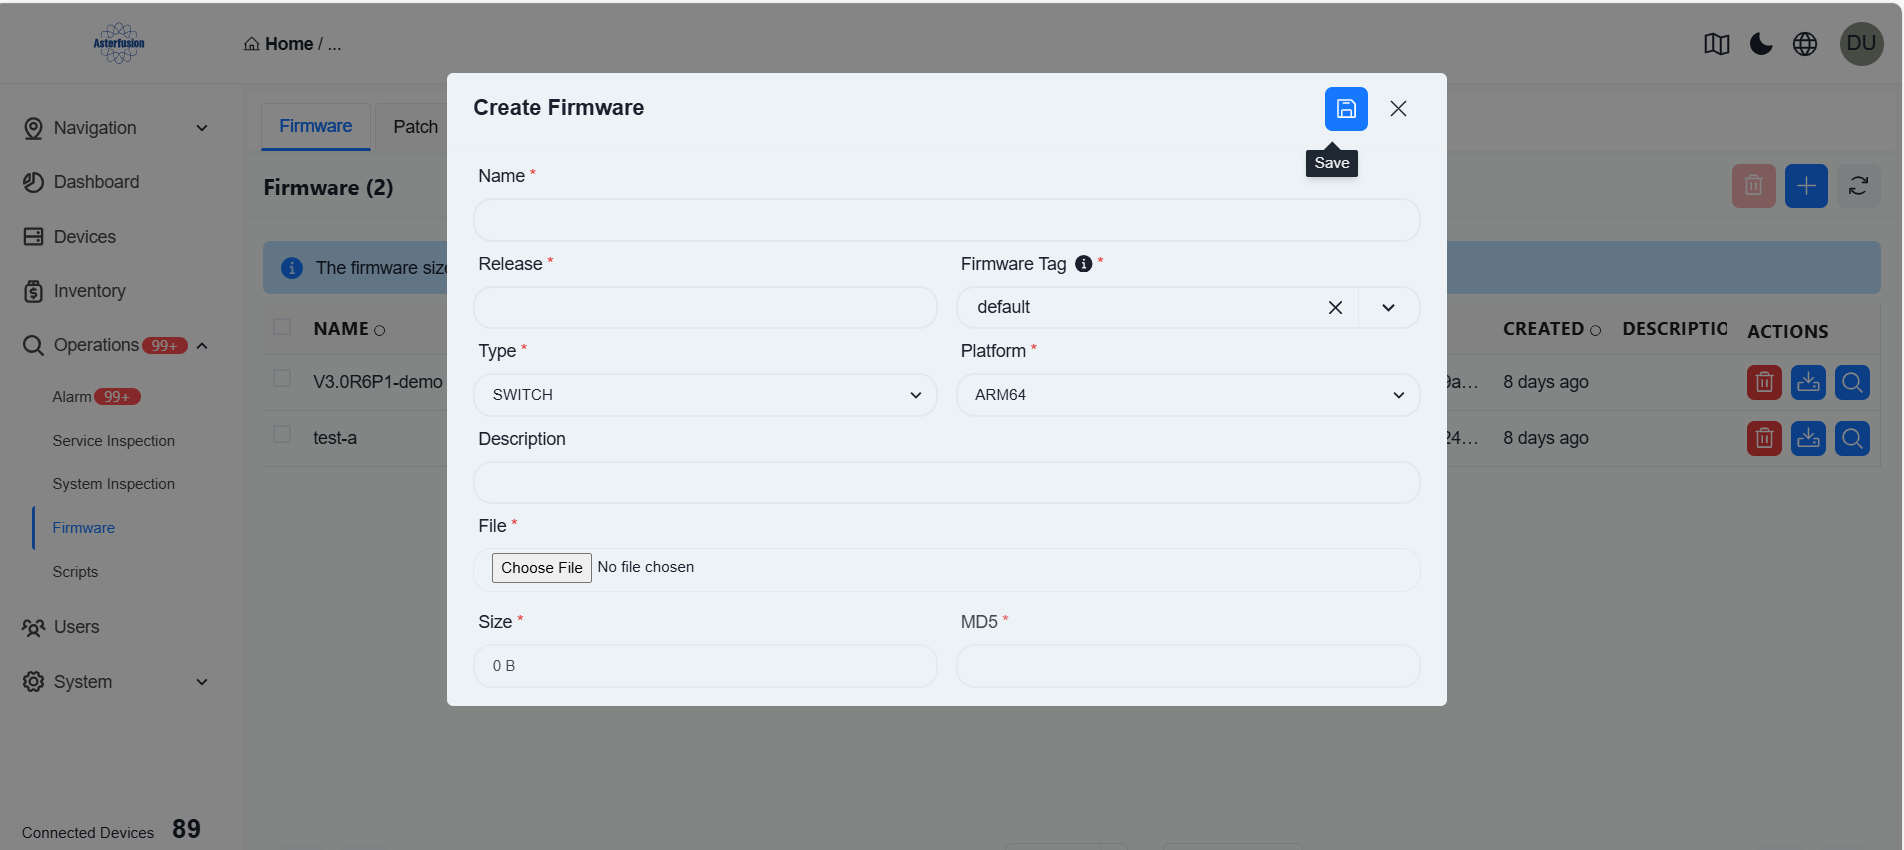 |
Firmware Use
Section titled “Firmware Use”| Procedure | Description |
|---|---|
| Step 1 | On the [Device] interface, select the corresponding device type, choose the device that needs to be upgraded, click the [Operation] button in the upper right corner, and select [Firmware Upgrade].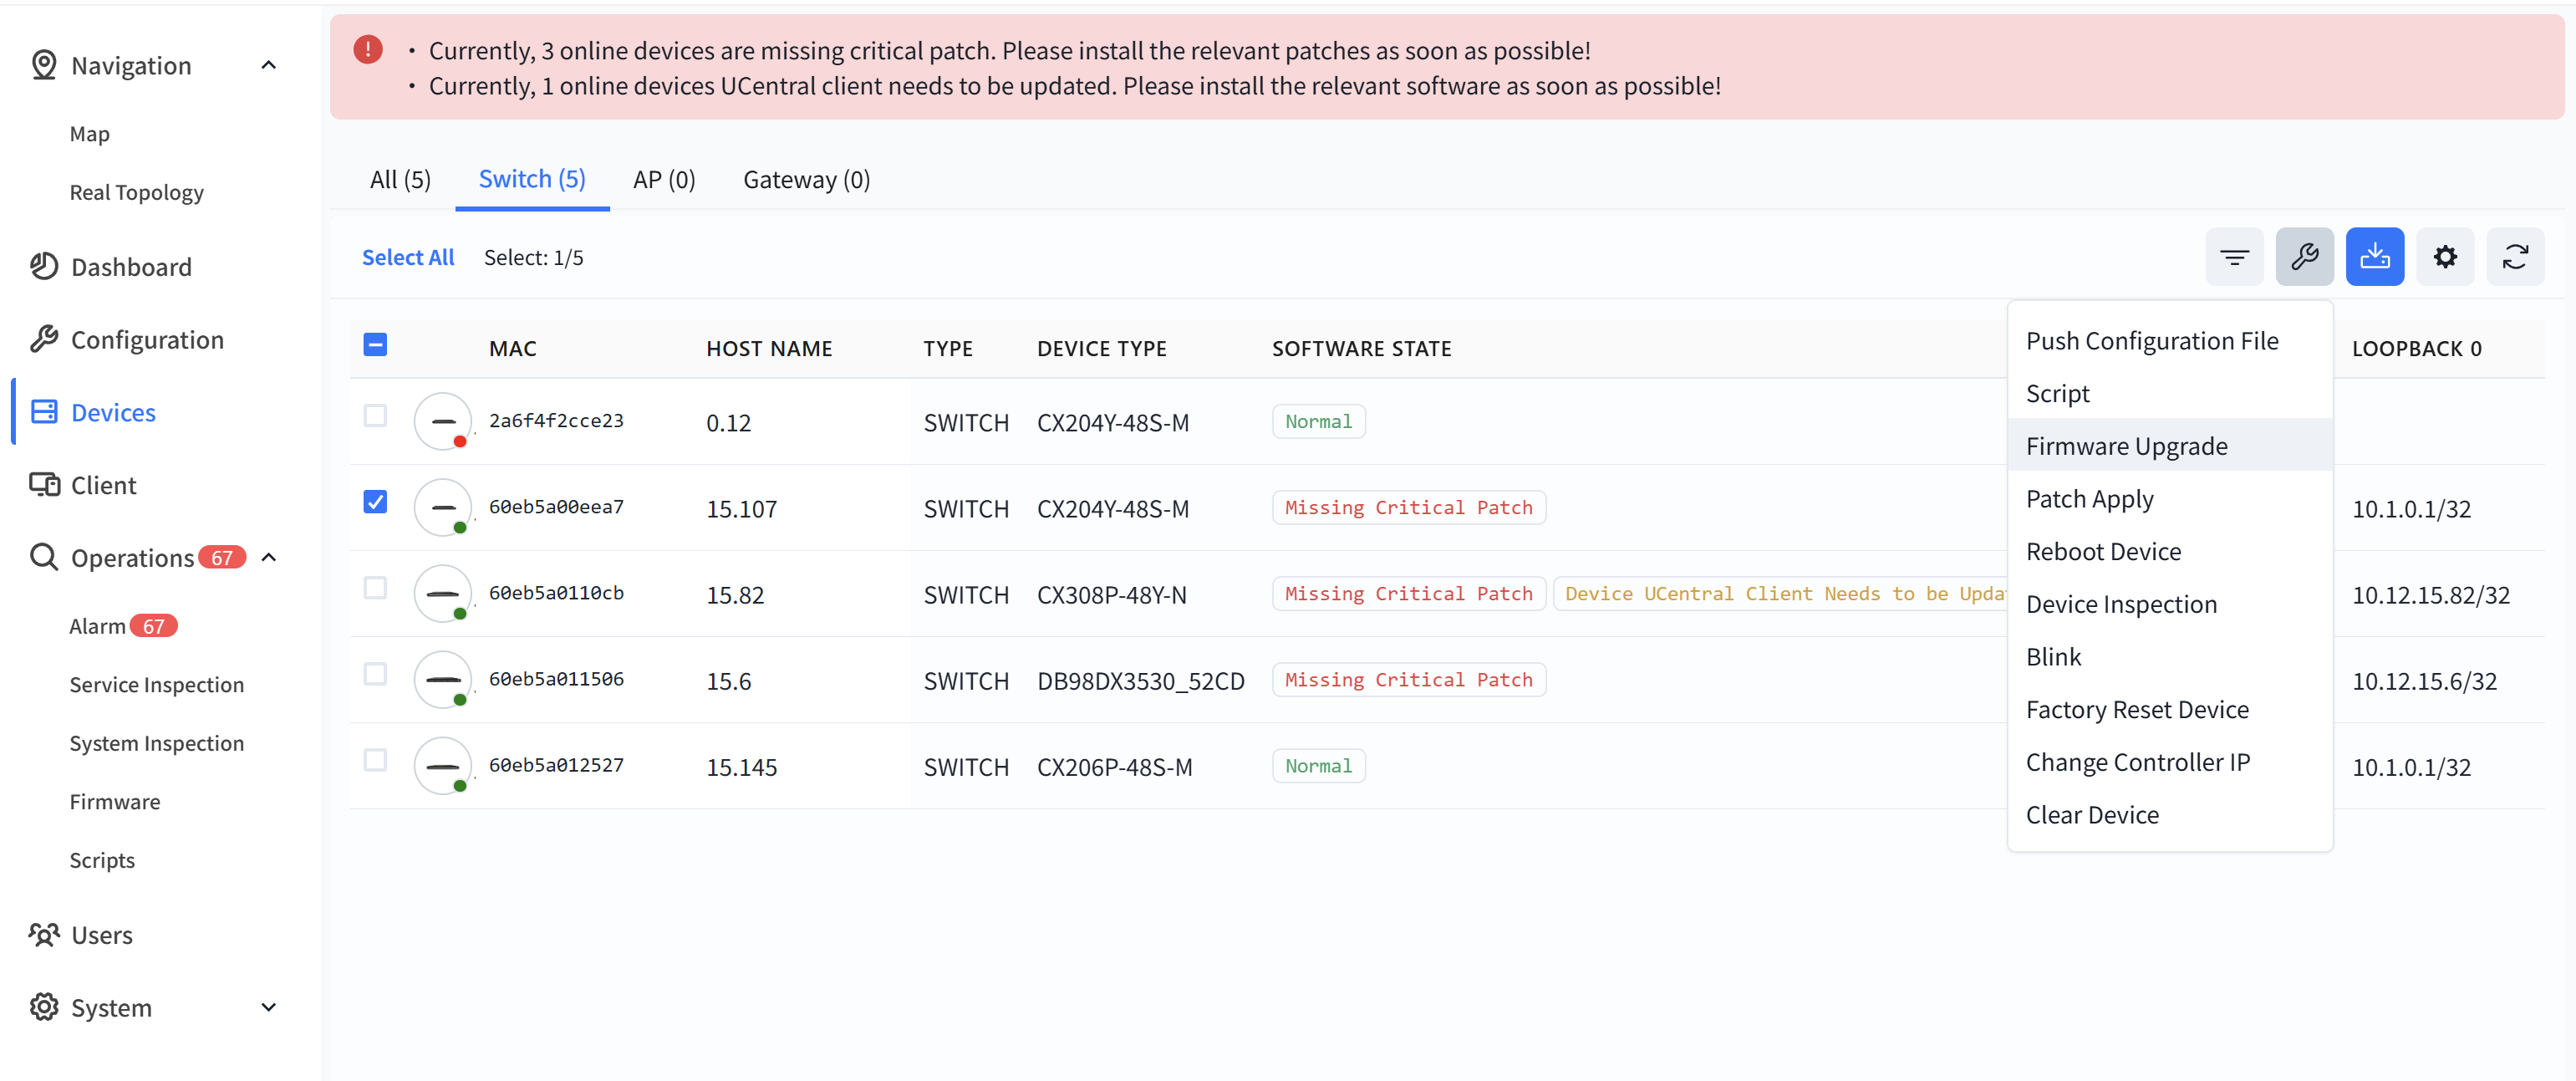 |
| In the pop-up window, click on [Release] to select the firmware image file that needs to be upgraded, and click [Next] to upgrade the firmware |
Note: The switch will not reboot automatically after the upgrade is completed, you need to manually perform the reboot operation to make the upgrade take effect.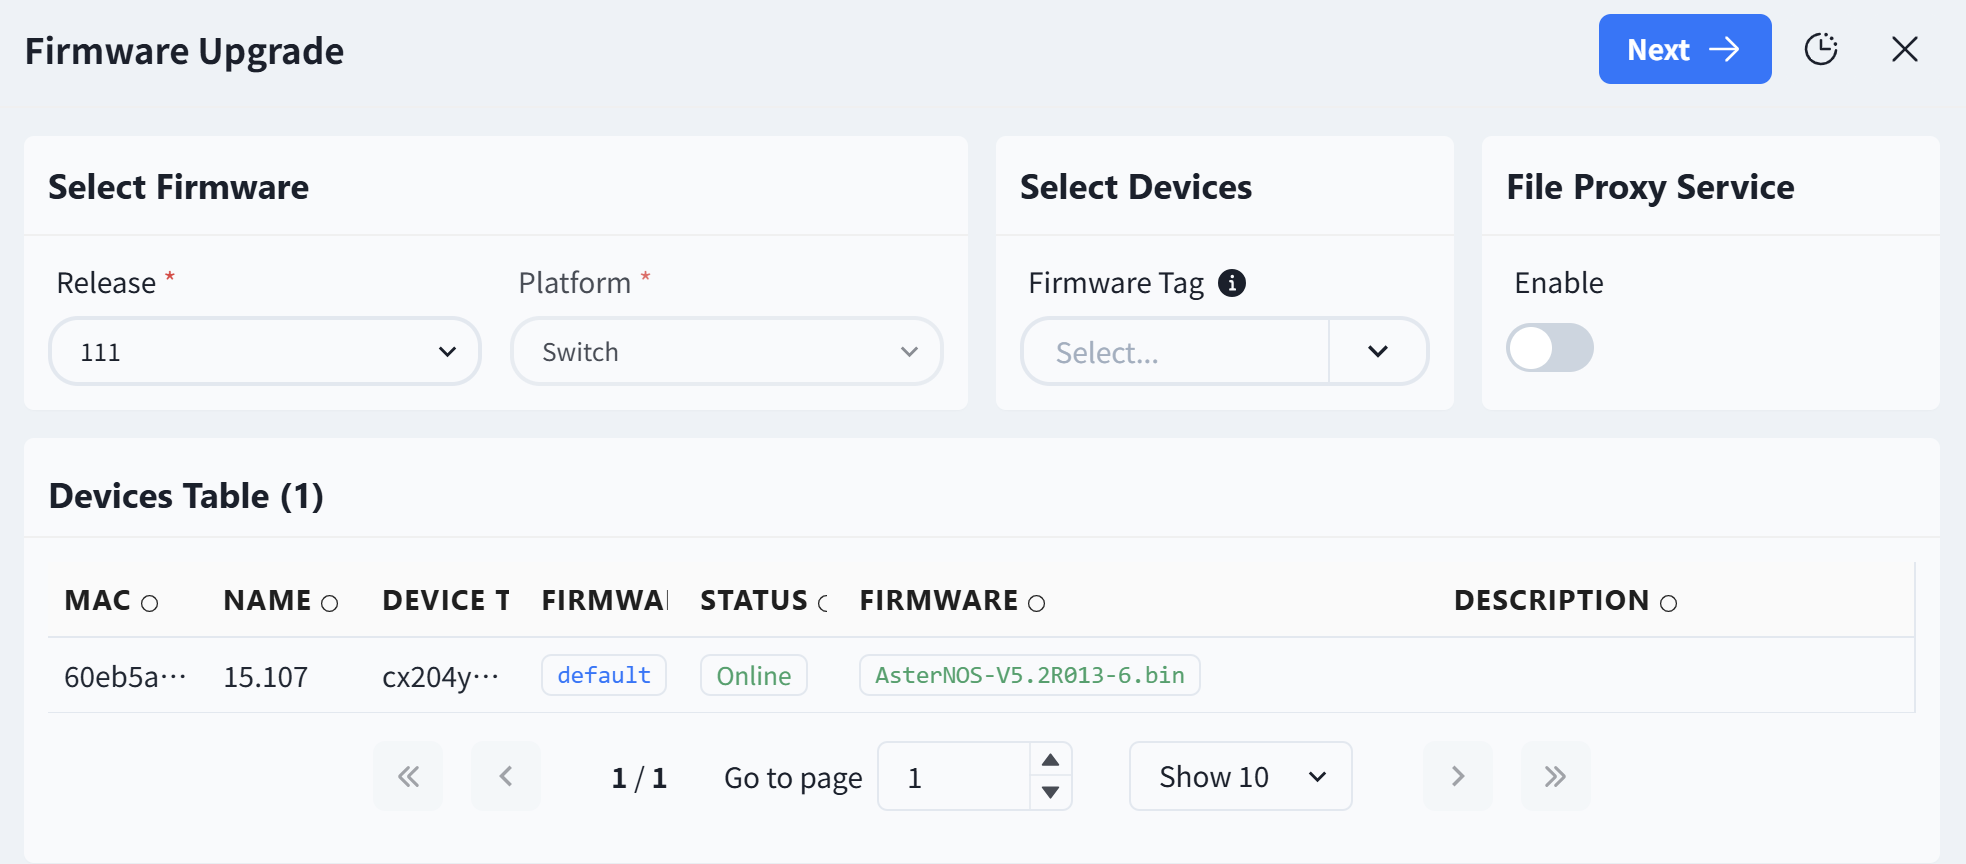 |
|
Patch Management
Section titled “Patch Management”Patch Upload
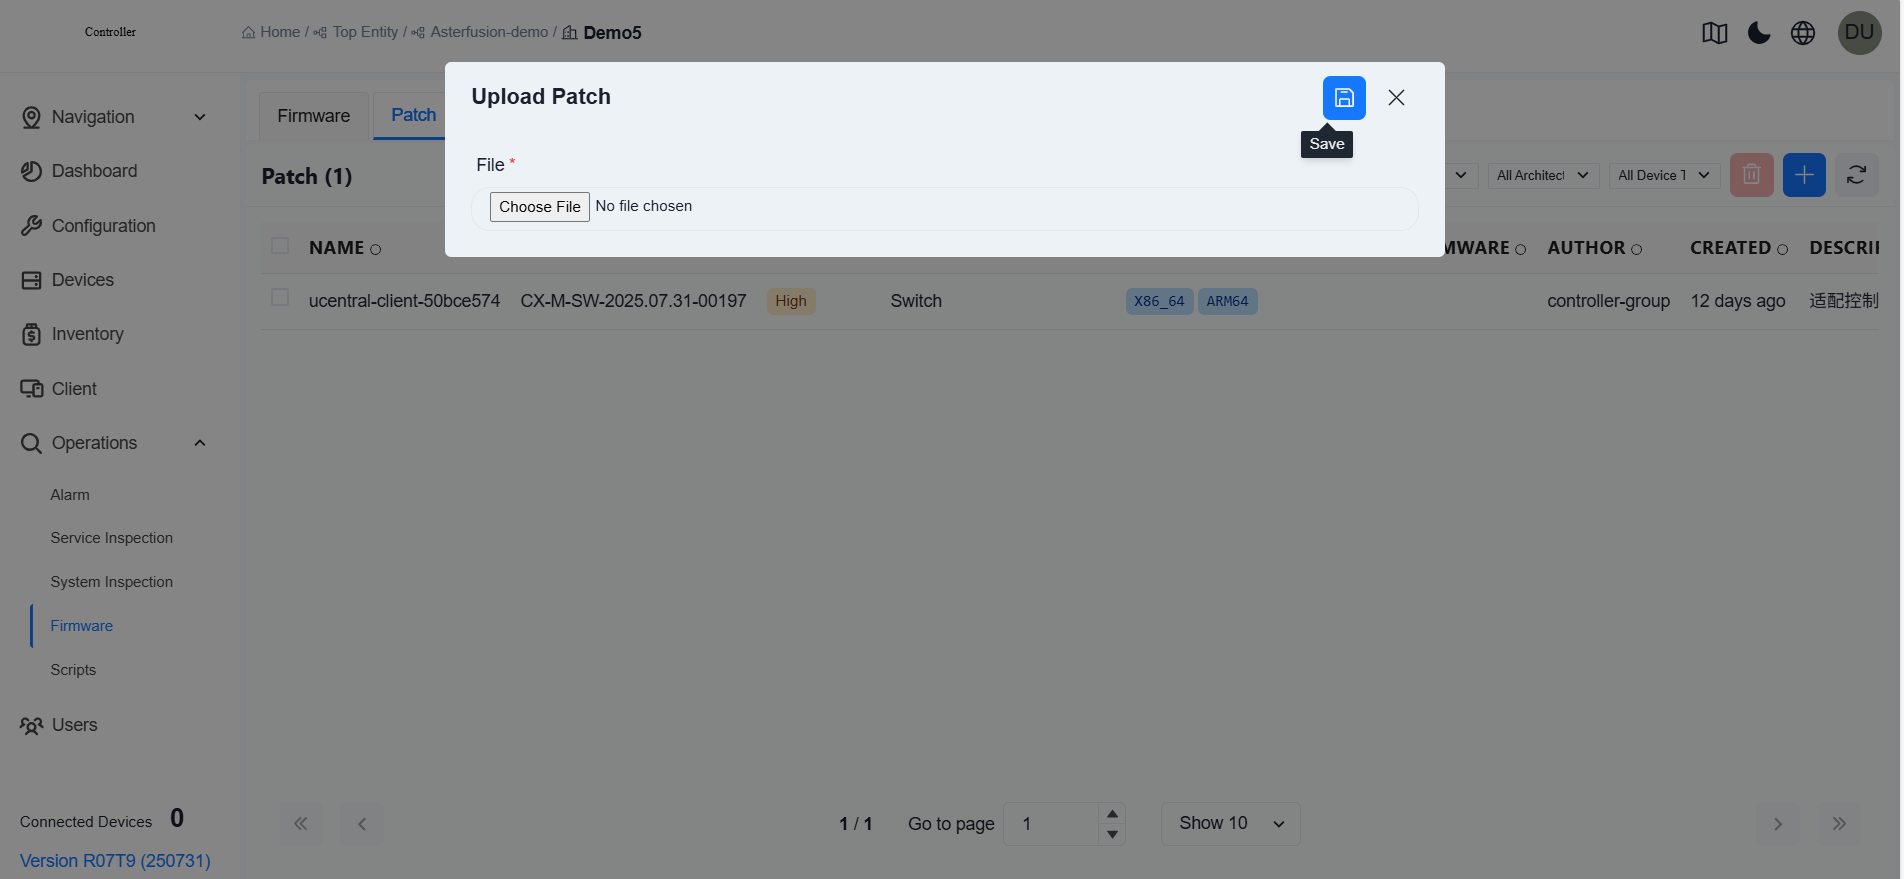
Section titled “Patch Upload”Patch management allows administrators to upload patch files to the controller, The controller automatically parses the patch content to ensure that patches are applied to the correct device platforms, thereby enhancing network security and device stability.
Key Functions:
Click [Operation] - [Firmware] - [Patch] - [+] to enter the patch upload view. Administrators can upload patch files in various formats (such as .bin, .tar.gz, .patch).
Patch Apply
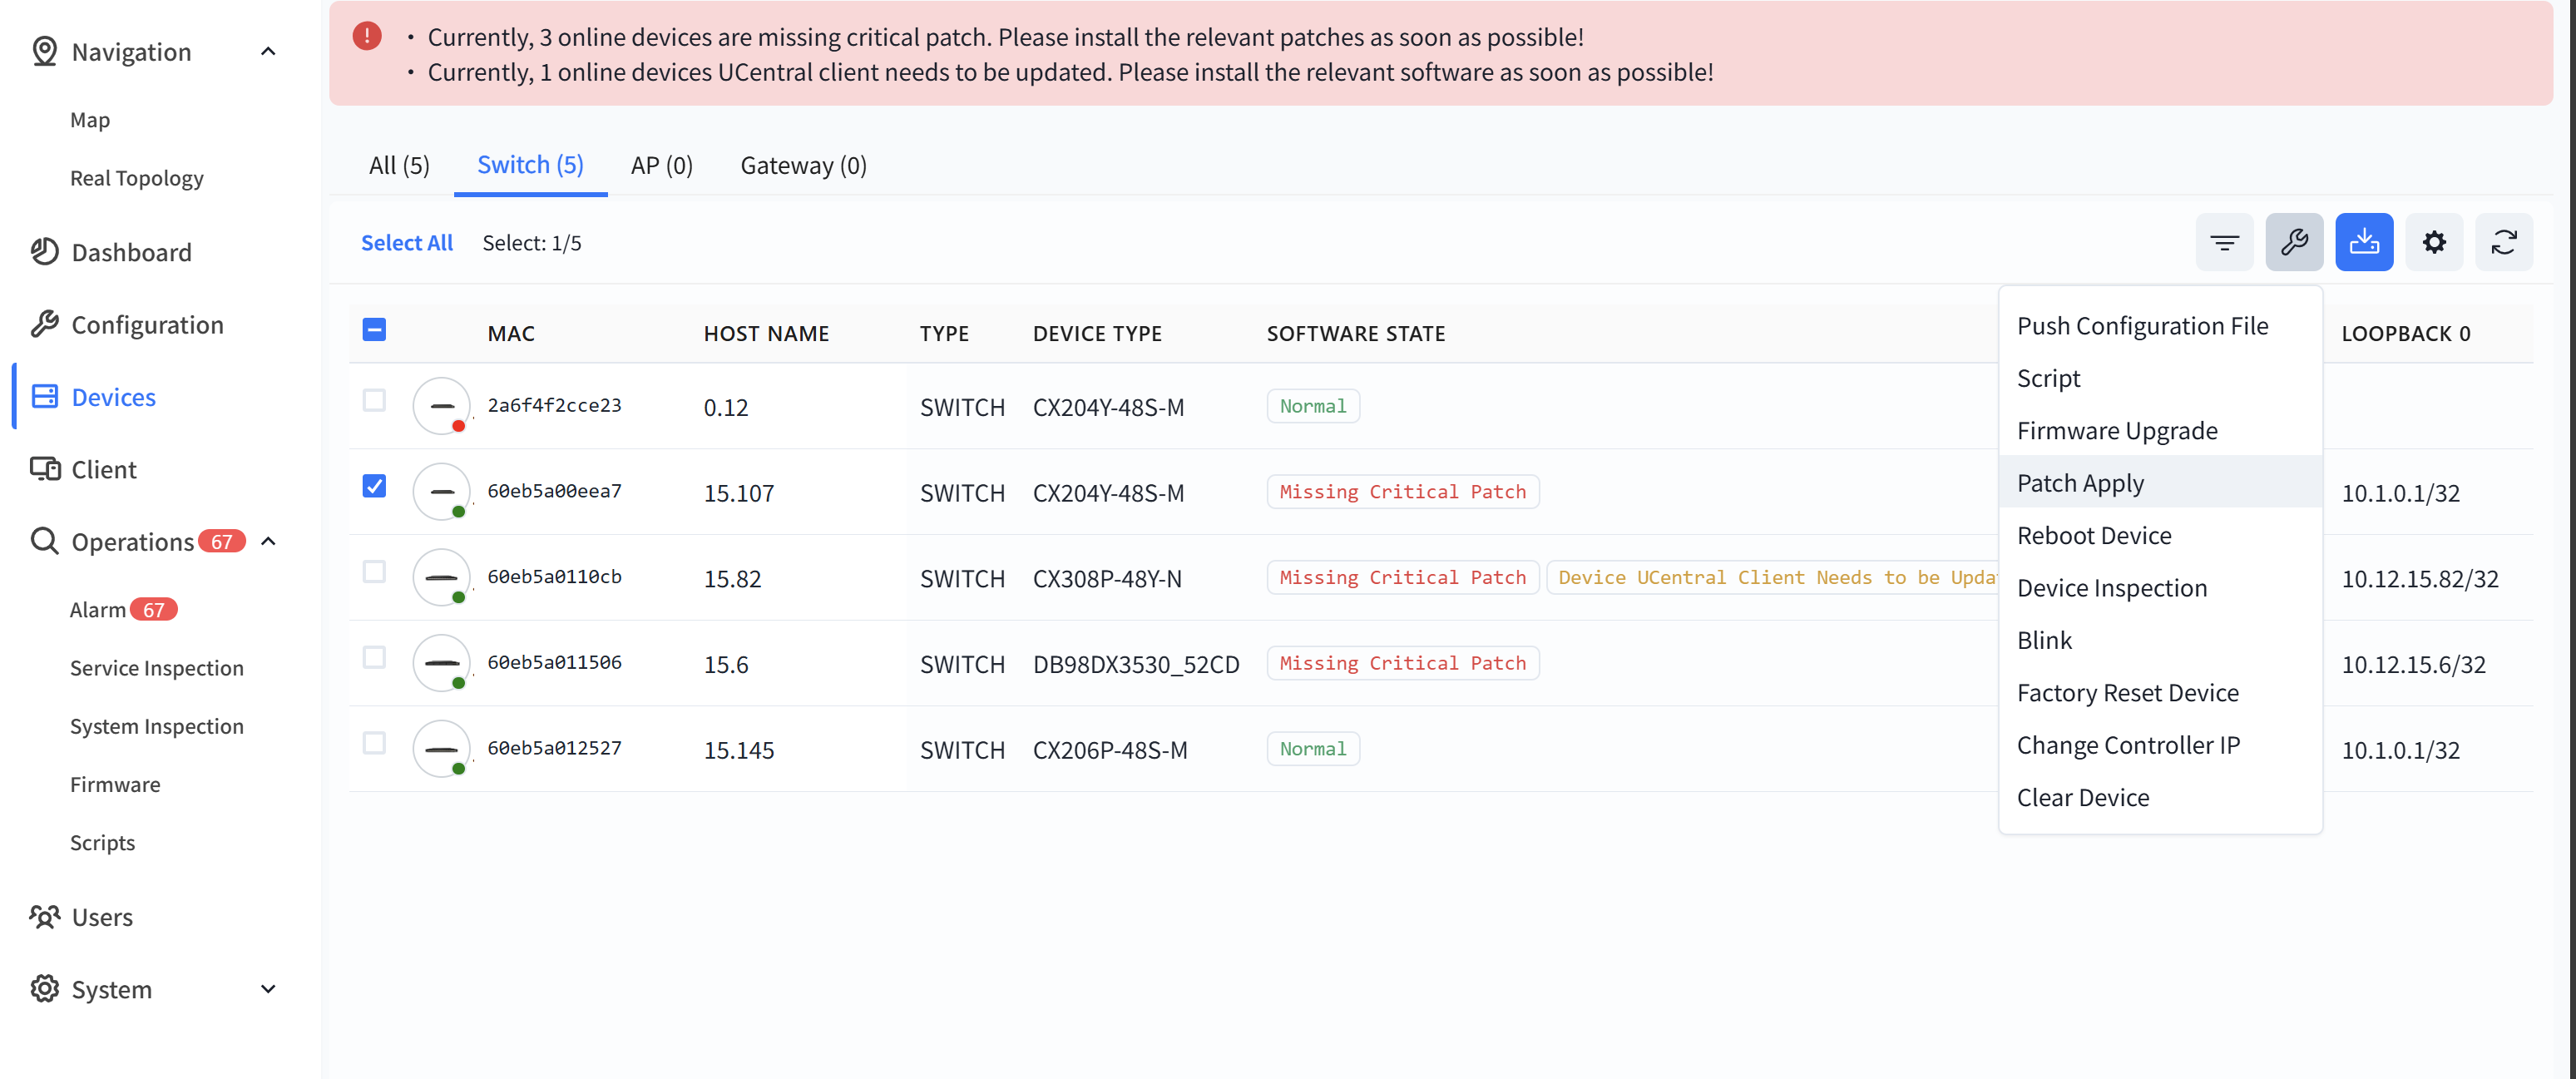
Section titled “Patch Apply”On the [Device] interface, select the corresponding device type, choose the device that needs to be upgraded, click the [Operation] button in the upper right corner, and select [Patch Apply].
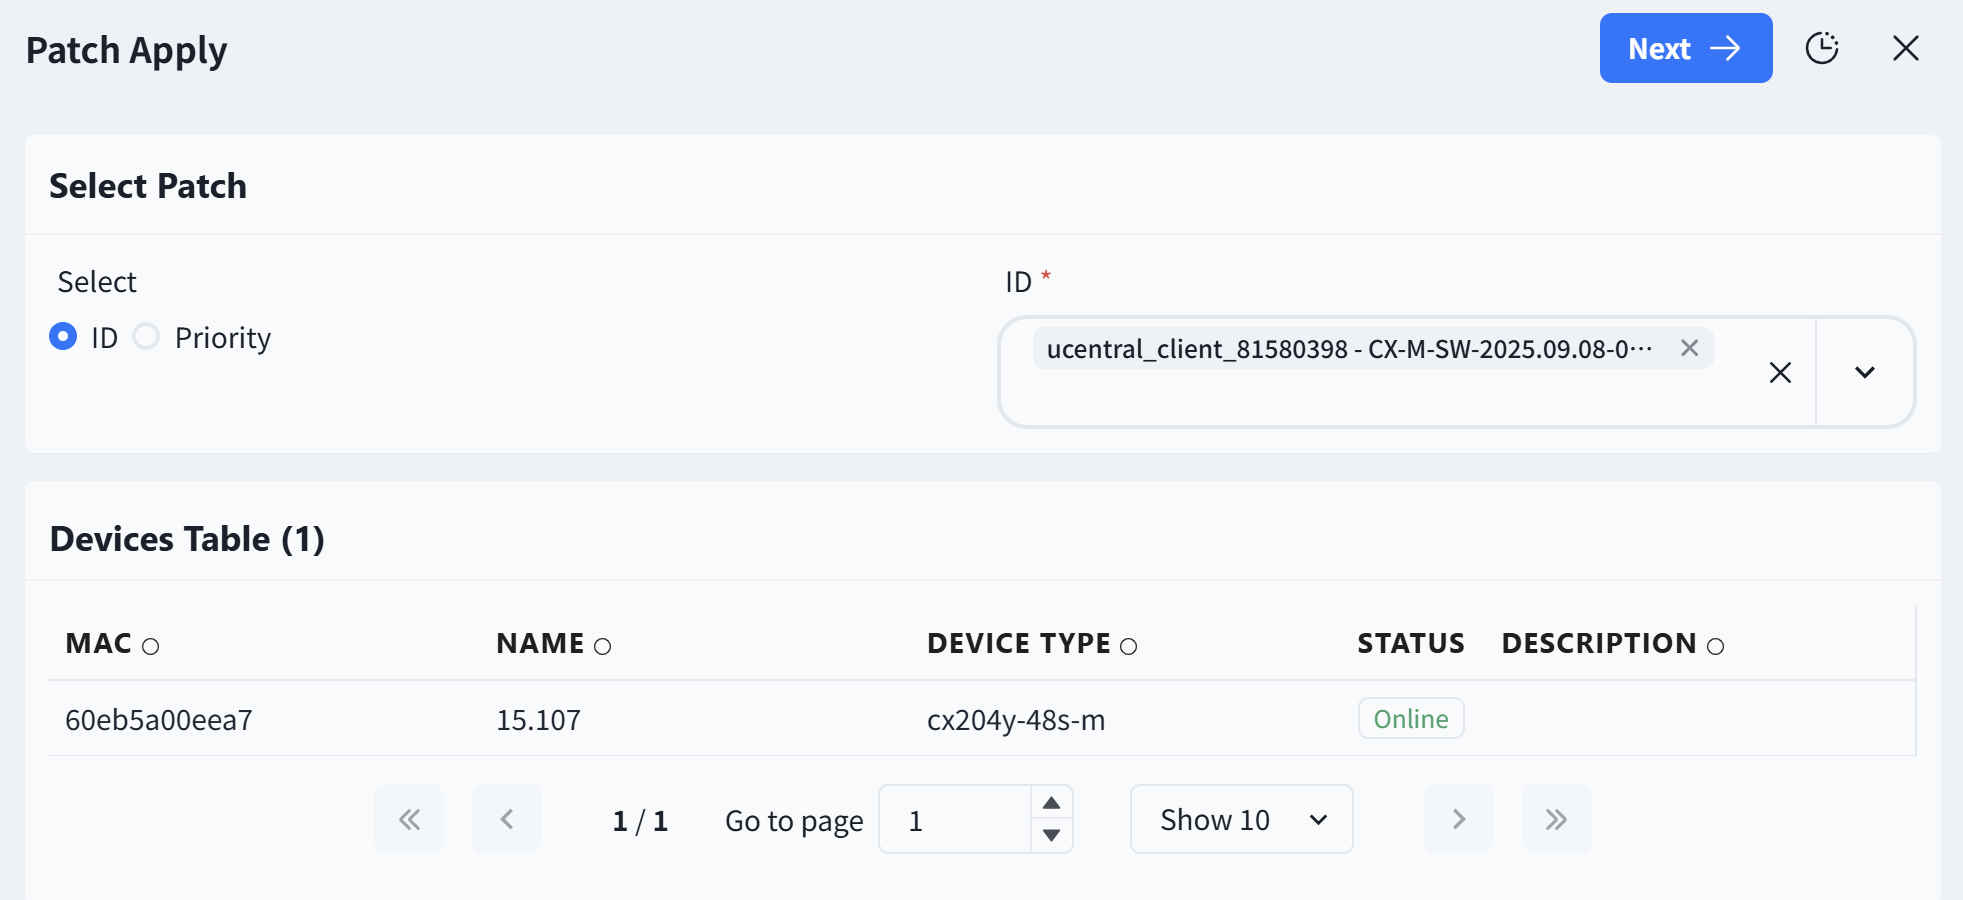
Filter the required patches and devices on the pop-up view, and click [Next] to apply the patches.
Alarm Management
Section titled “Alarm Management”Alarm Item Configuration
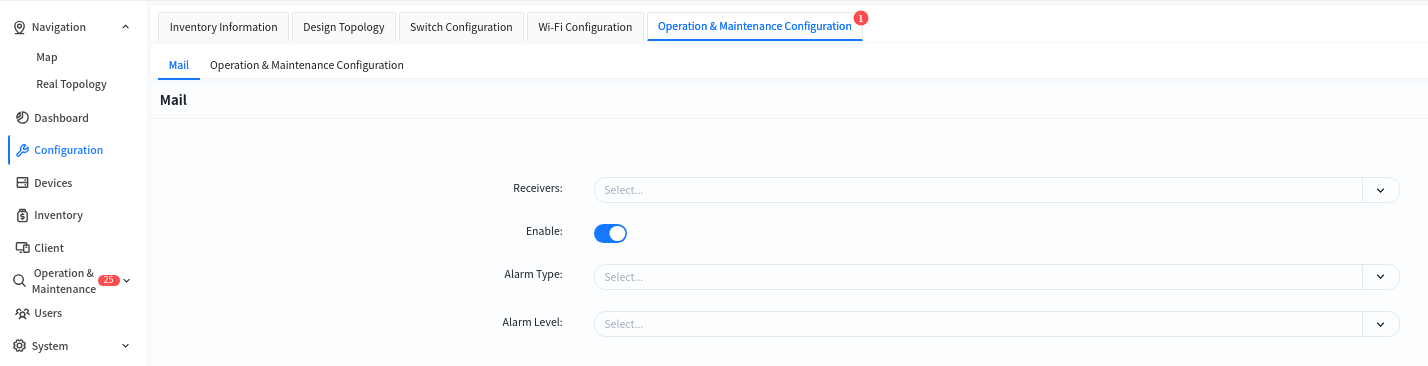
Section titled “Alarm Item Configuration”Administrators can configure the recipients of alarm emails and alarm thresholds in the [Configuration] - [Operations Configuration] view of the designated venue. By default, all alarms supported by the controller are enabled.
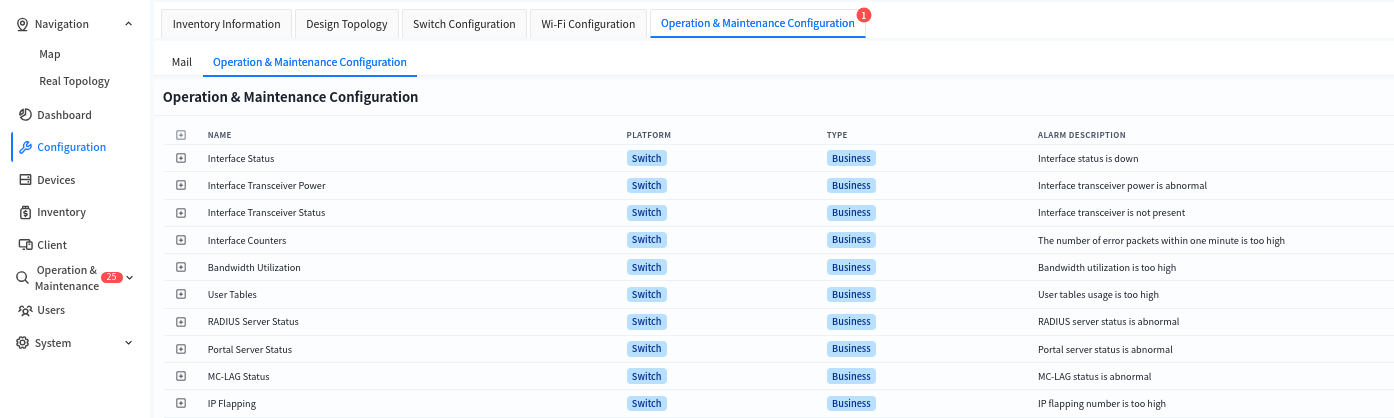
The controller supports the following alarms:
| Alarm Type | Alarm Item |
|---|---|
| Interface Status Wireless Terminal Type | Interface UP/Down status change Change in the vendor type corresponding to the MAC address |
| Interface Module Optical Power | Optical power of the optical module |
| Interface Module Status | Presence status of the interface module |
| Bandwidth Utilization | Bandwidth utilization rate |
| User Table Entries | ARP entry resource utilization |
| IPv4-host-route: /32 host route entry resource utilization | |
| IPv4-route: Route entry resource utilization | |
| IPv6-host-route: /128 IPv6 host route entry resource utilization | |
| IPv6-route: IPv6 route entry resource utilization | |
| MAC entry resource utilization | |
| Route-nexthop: Next-hop resource utilization of route entries | |
| RADIUS Sever Status | Detected operating status of the RADIUS server |
| PortalSever Status | Detected operating status of the Portal server |
| MC-LAGStatus | Operational status of the MC-LAG protocol |
| IP Flapping | Unusually frequent flapping of IP addresses across different switches |
| MAC Flapping | Unusually frequent flapping of MAC addresses on different interfaces of the same switch |
| Interface POE Status | Change in the POE status of the interface |
| POE Total Power Utilization | Percentage of current total power supply of the POE switch to the rated POE power supply |
| Device Connection Status | Change in the connection status between the device and the controller |
| CPU Utilization Rate | - |
| Memory Utilization Rate | - |
| Disk Utilization Rate | - |
| temperature | CPU core temperature |
| FAN temperature | |
| PCB PCB temperature | |
| SWITCH switch chip temperature | |
| Fan | Presence status of the fan module |
| Fan speed | |
| Psu | Presence status of the power supply module |
| Power supply status | |
| Core Dump File Status | Resource utilization rate of core dump files |
| Docker Status | Docker status on switch |
| BGP Connection Status | Change in the connection status of BGP neighbors on the switch |
| BFD Connection Status | Change in the connection status of BFD neighbors on the switch |
Mail Sender
Section titled “Mail Sender”Click [System] - [Mail Sender] to modify the source mailbox for sending alerts.

Click [Connectivity] to test the connectivity between the controller and the email server, preventing alarm emails from failing to be sent normally due to network connectivity issues.
Alarm Message
Section titled “Alarm Message”Administrators can view alarm information for all devices within their management authority in the [Operations] - [Alarm] view.
- Active Alarms: Displays alarm items that still exist currently.
- Alarms History: Displays alarm items that showed abnormalities before but have returned to normal.
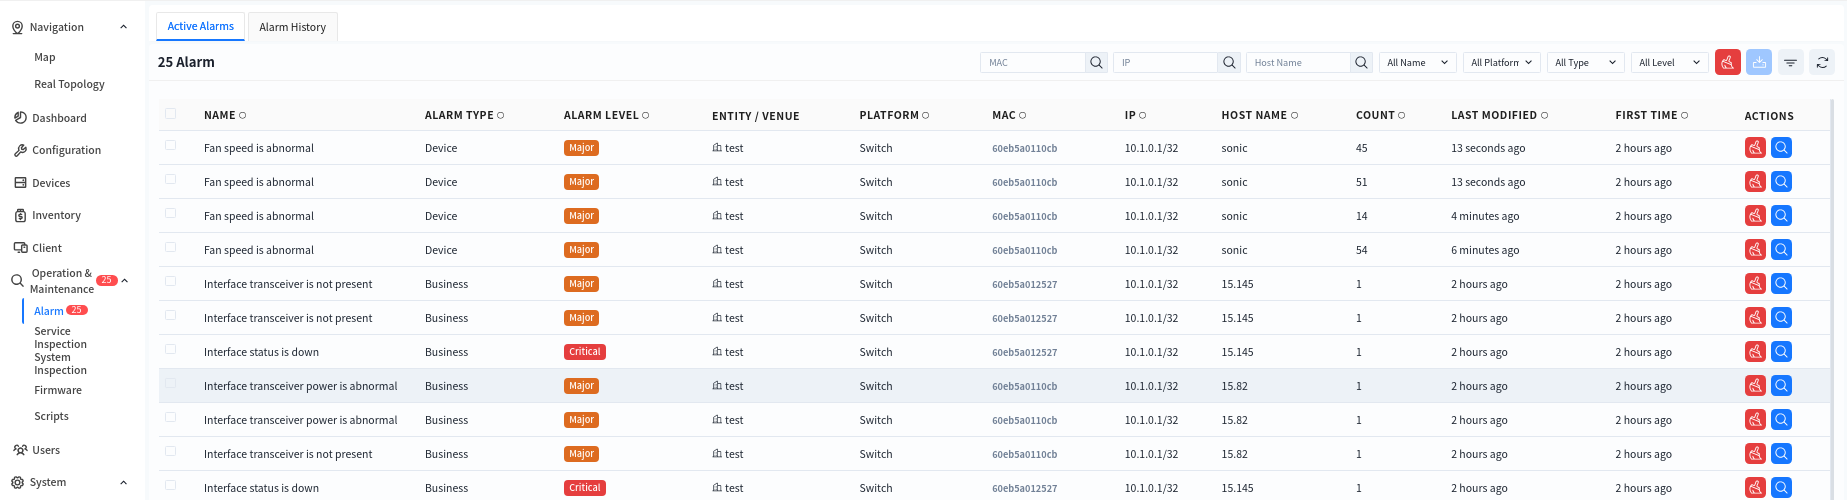
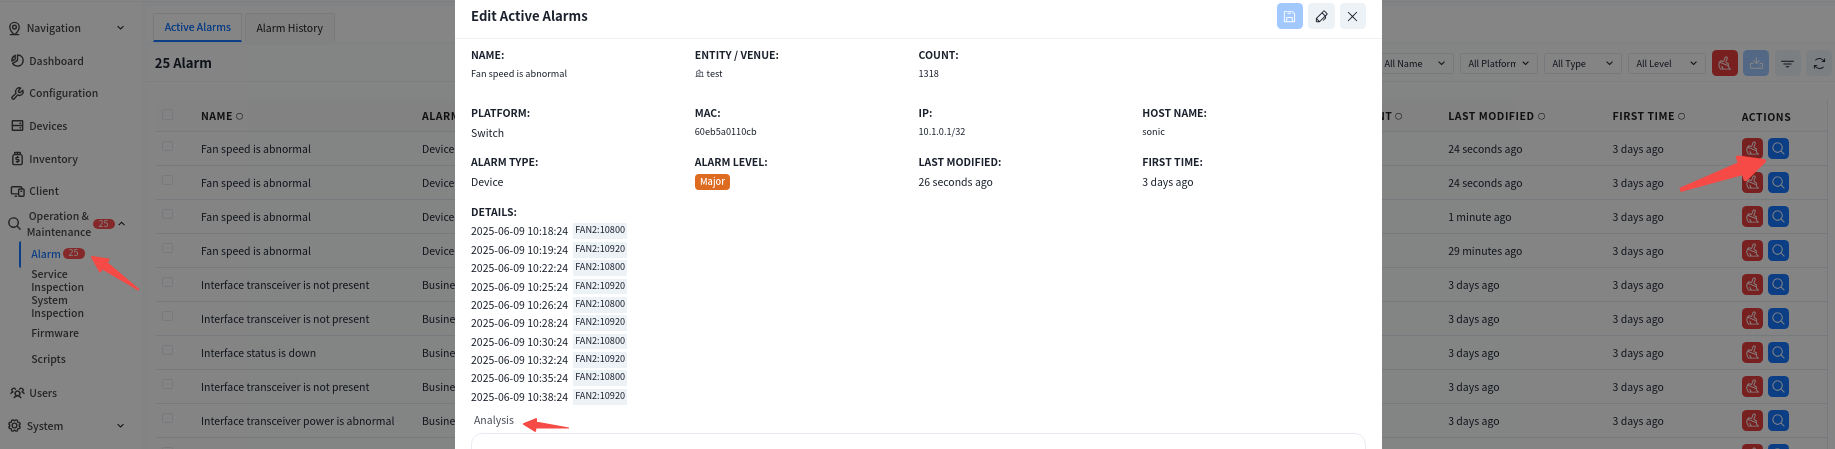
Click the alarm item to view specific alarm information and process it. Click the [Edit] button, fill in the processing information for the current alarm in the [Analysis] section, and click the [Save] button to complete the edit. After that, this alarm information will no longer be displayed in [Active Alarms] but will be stored as a processed alarm in [Alarm History].
Device Inspection
Section titled “Device Inspection”The device inspection feature is designed to regularly check and monitor network devices to ensure their normal operation and detect potential faults in a timely manner. Its main functions include:
- Device Status Monitoring: Checks critical parameters such as CPU usage, memory usage, storage, and port status to ensure devices are functioning properly.
- Log and Alarm Management: Collects device logs, analyzes abnormal events, and triggers alarm mechanisms.
- Critical Process Status Check: Monitors the status of essential processes to ensure smooth business operations.
- Automated Inspection Tasks: Supports scheduled inspection tasks, generates inspection reports, and facilitates network maintenance.
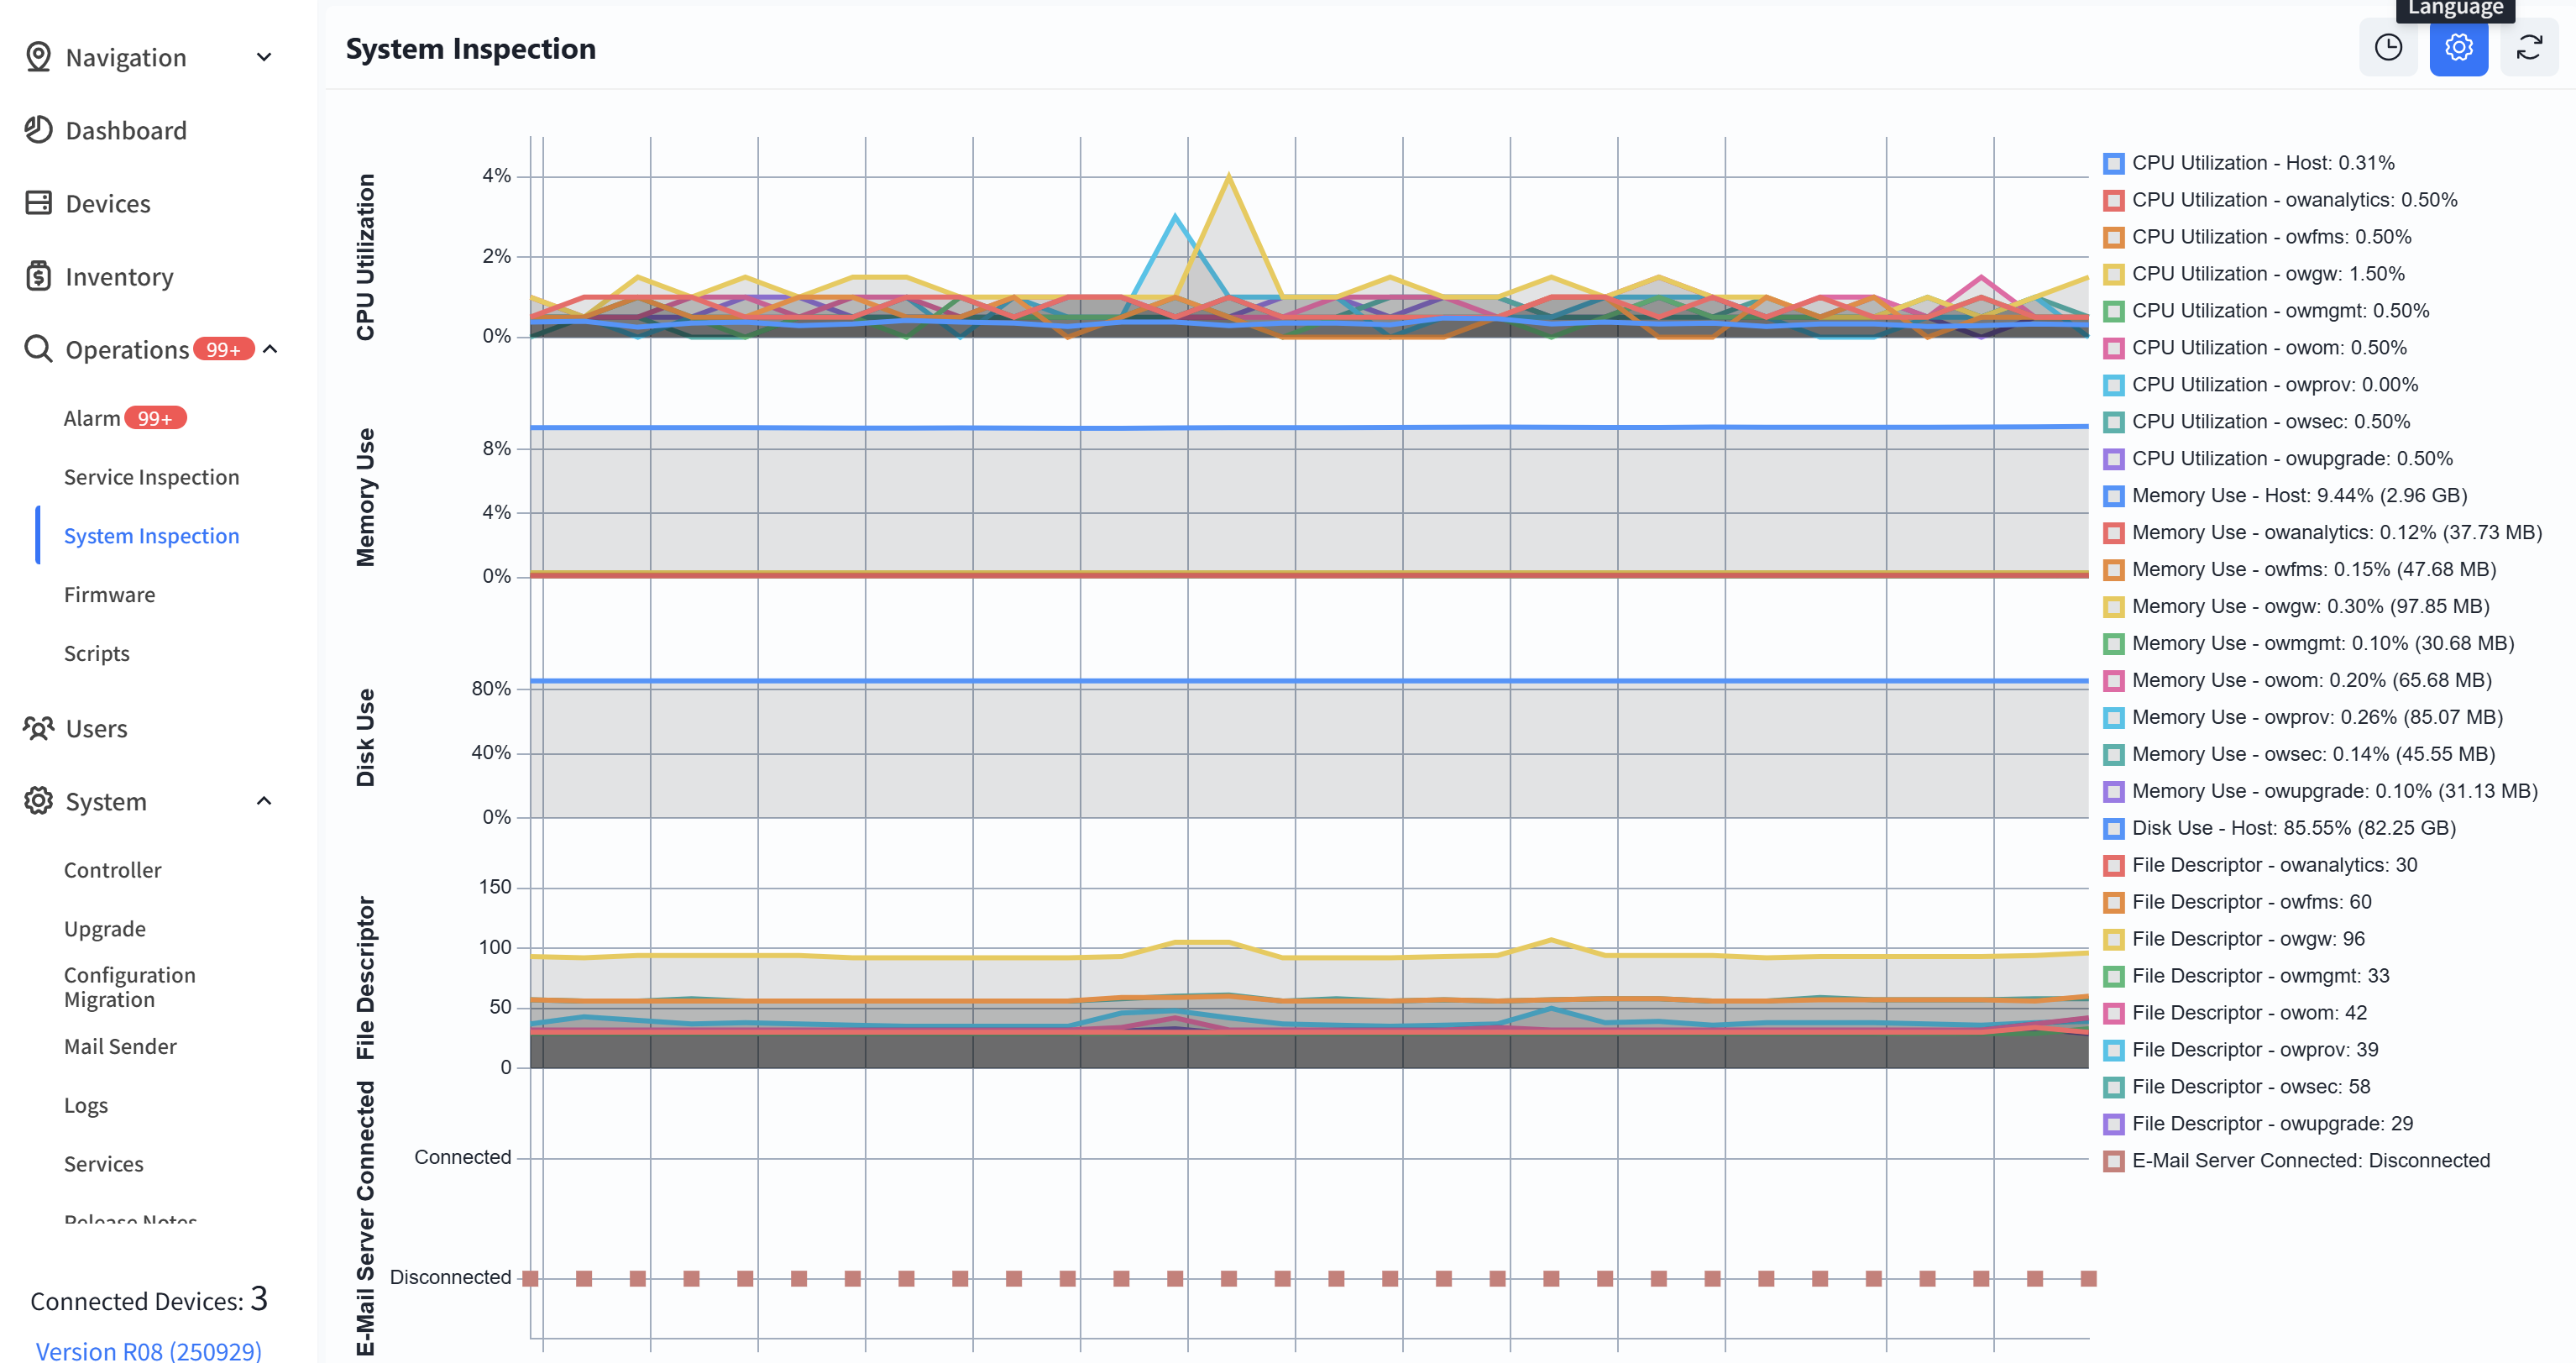
System Inspection
Section titled “System Inspection”System inspection refers to the periodic check of the controller’s internal system to ensure stable and efficient operation. Key inspection items include:
- CPU & Memory Usage: Monitors CPU load and memory consumption to prevent system failures due to resource exhaustion.
- Disk Usage Check: Examines disk usage to prevent logs or cached data from consuming all available storage, which could impact system performance.
- Files Descriptor: Verifies the proper functioning of critical services (e.g., network management, authentication, logging) and automatically restarts abnormal processes.
- E-Mail Server Connected: Tests the controller’s connectivity with the email server to ensure alert notifications are successfully sent.
System inspections can be scheduled at fixed intervals (e.g., every 5 minutes or every hour) and automatically generate inspection reports for administrators to analyze and optimize system performance.
Business Inspection
Section titled “Business Inspection”Business inspection refers to periodic or on-demand checks of network device operation to ensure stable business operations and prevent potential failures.
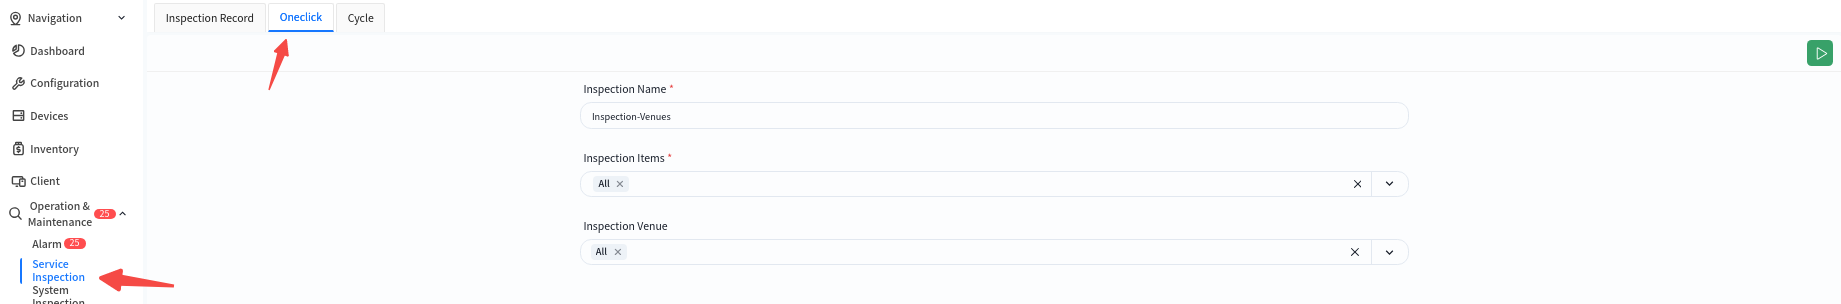
One-Click Inspection
This feature allows users to specify inspection items and target venues for an instant inspection, defining the scope of the inspection accordingly.
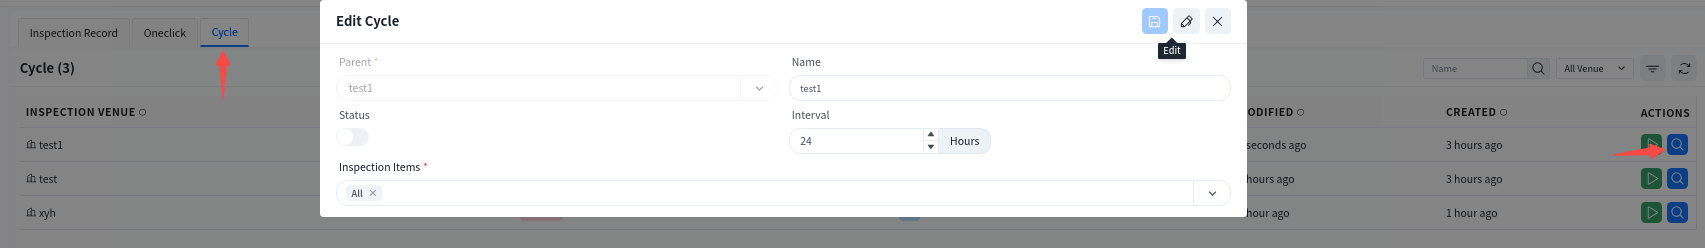
Cycle Inspection
Cycle inspection is configured based on the needs of different venues, allowing for automated inspections at scheduled intervals without manual intervention, thus improving operational efficiency. Click the [View Details] button to view/edit the periodic inspection settings for the selected venue.
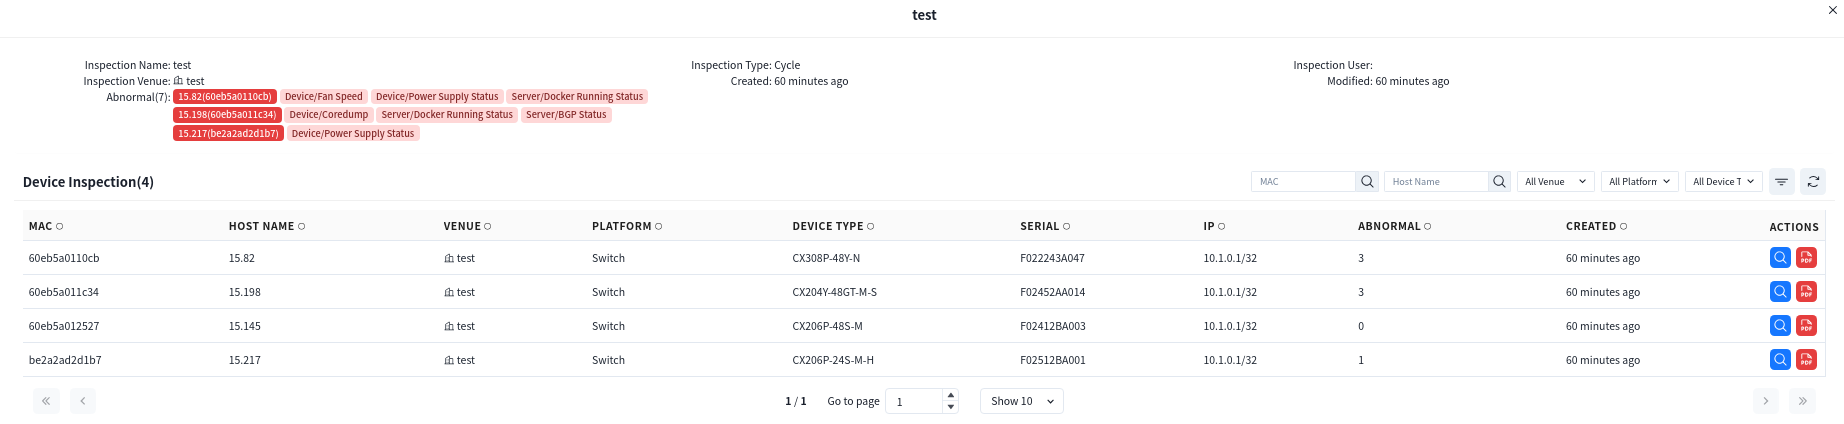
Inspection Records
Section titled “Inspection Records”Both one-click inspections and periodic inspections are logged in the inspection records. Click the [View Details] button to check the inspection results. All detected anomalies will be listed under the [Abnormal] section. Administrators can: Click [Actions] - [View Details] to check the inspection results of a specific device. Click on the MAC address to directly navigate to the device management interface for further analysis.