Status Visualization
The controller has a powerful monitoring function and can monitor the information of the entire network in real time. Through the detailed dashboard display, administrators can keep track of the operating status of the equipment at any time.
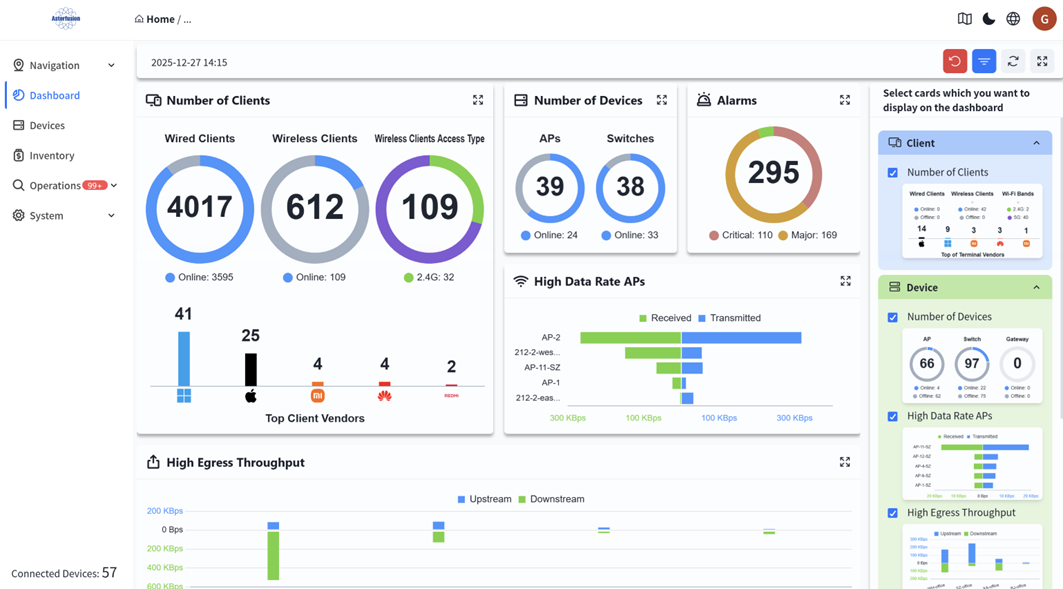
Organization Dashboard
Section titled “Organization Dashboard”Administrators can enter the specific organization in the [Navigation] screen to view an overview of the status of devices and terminals under all premises within the organization. You can also adjust the display cards according to your own preferences.
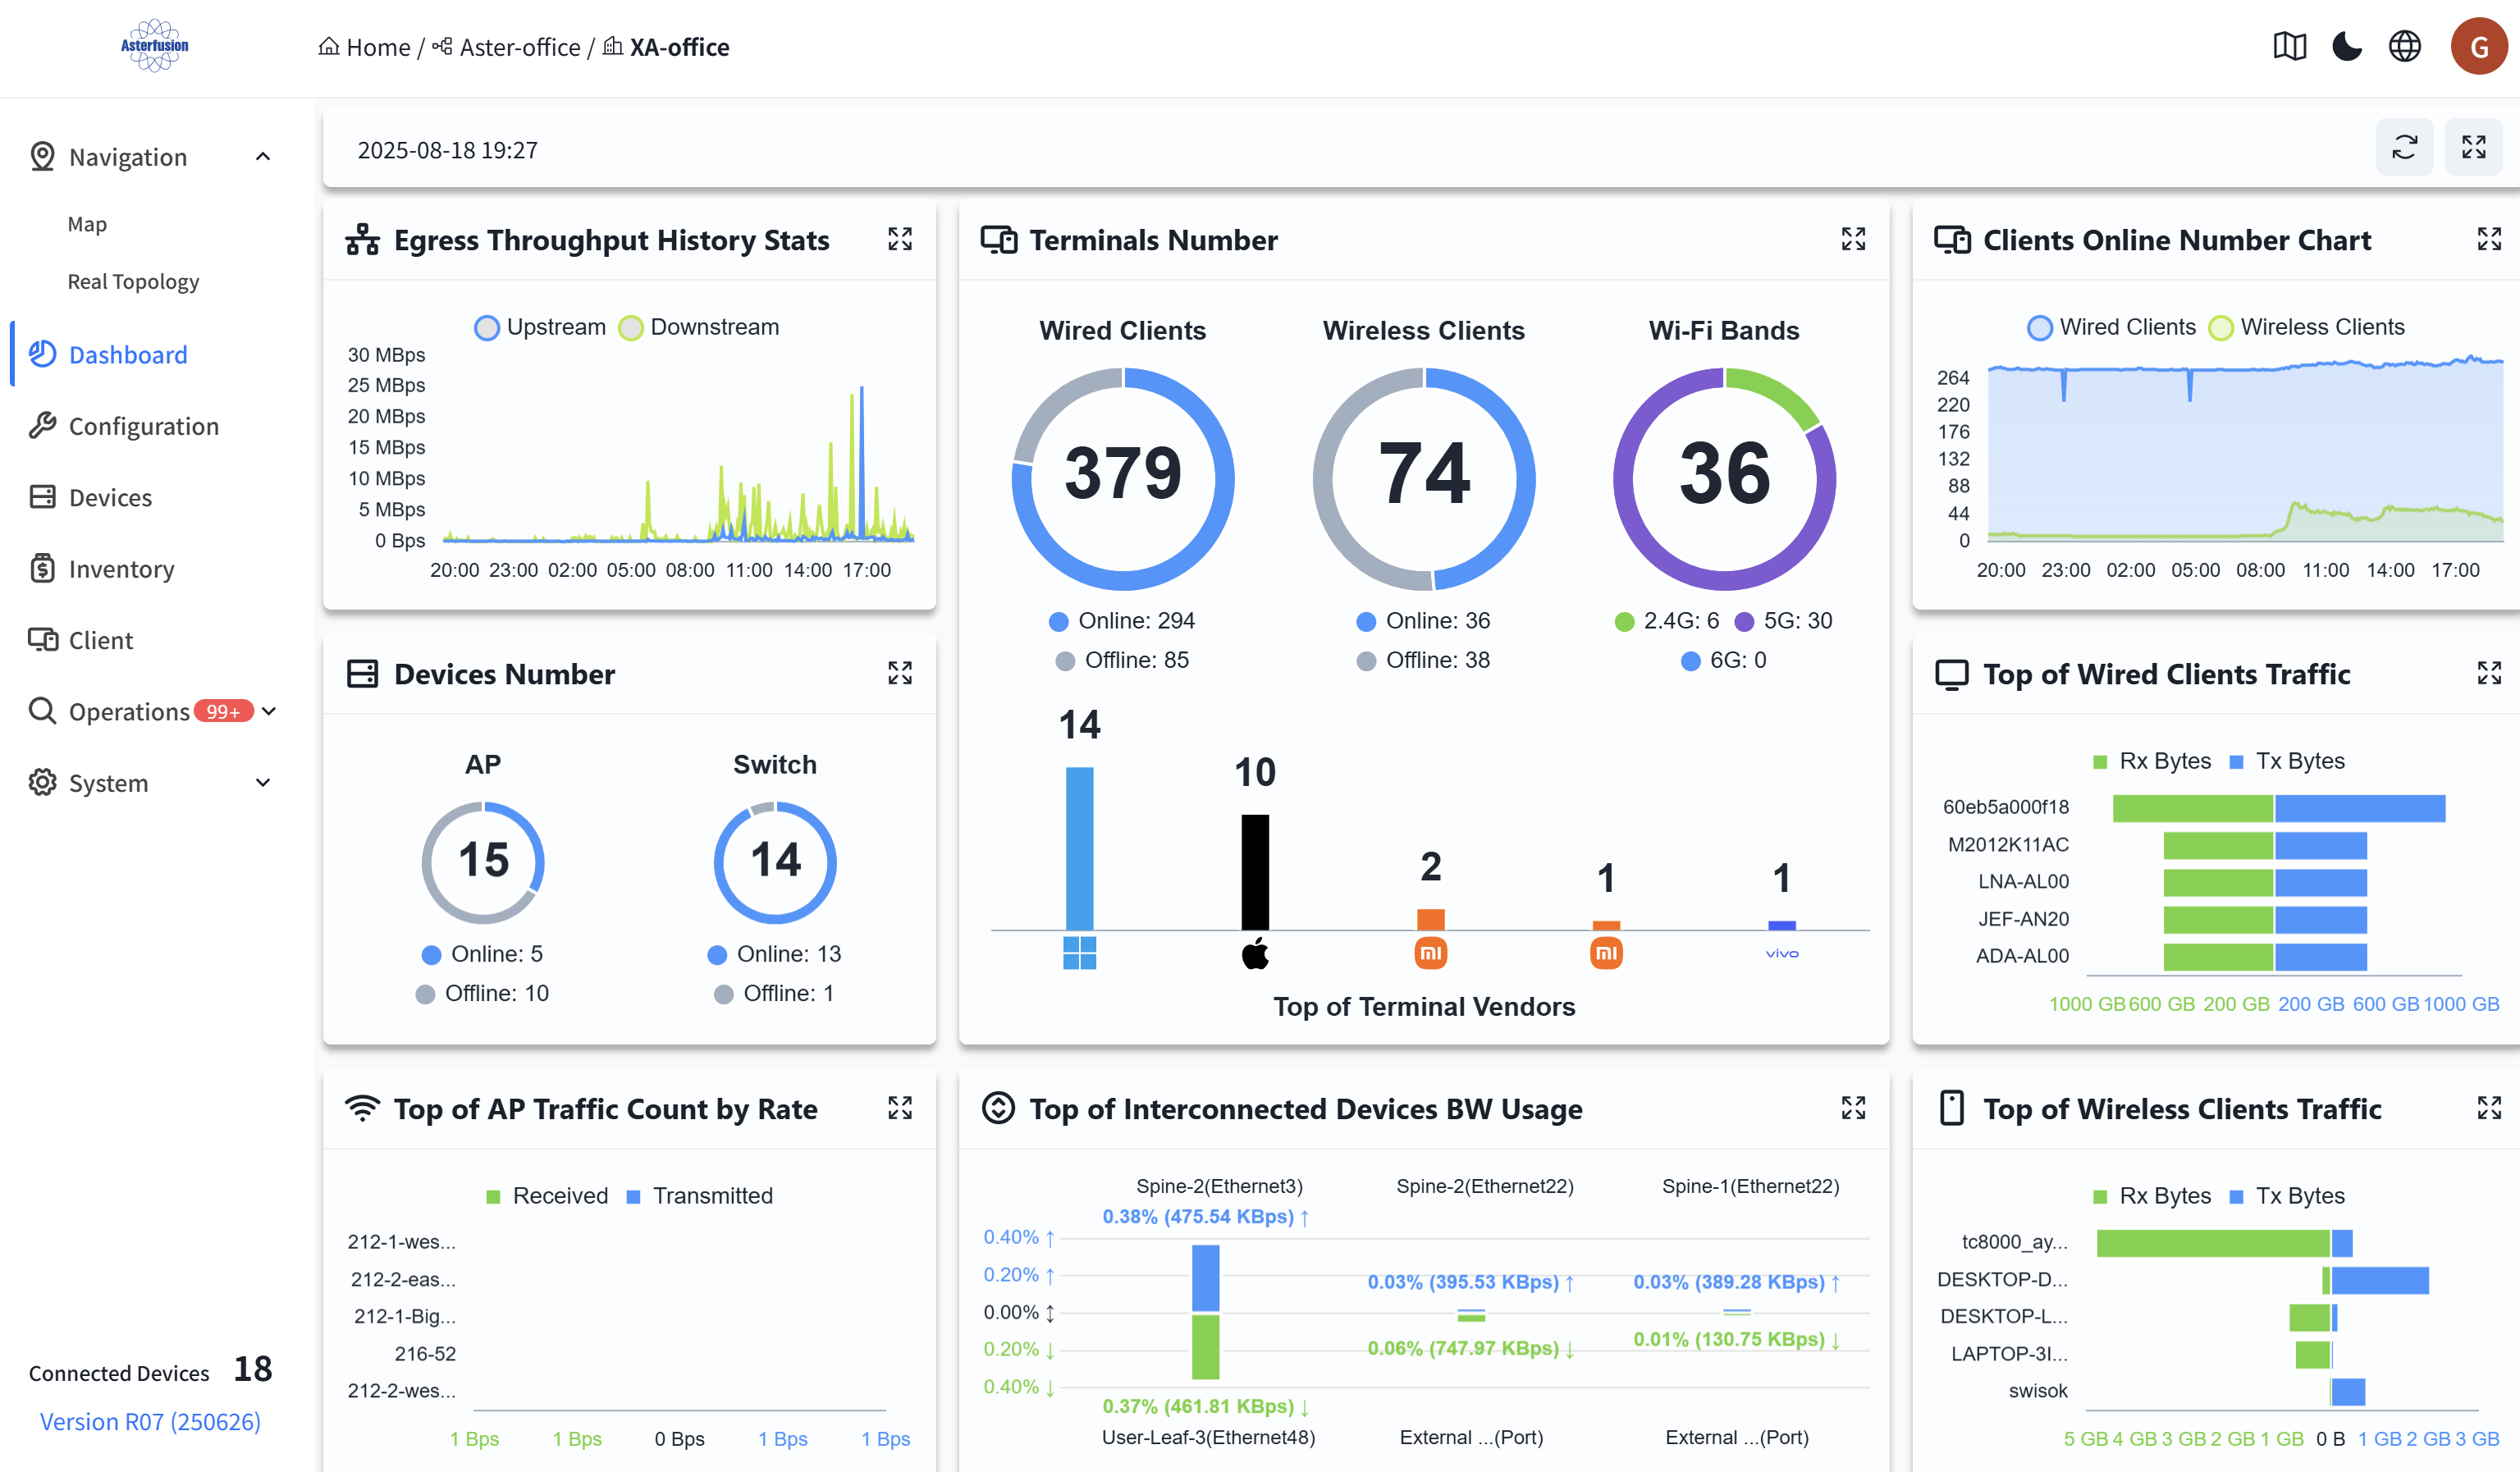
Venue Dashboard
Section titled “Venue Dashboard”Administrators can enter a specific organization on the [Navigation] view to view an overview of the status of devices and terminals under all venues within the organization’s scope, and it supports clicking to jump to the selected terminal. Users can adjust the display cards according to their own preferences.
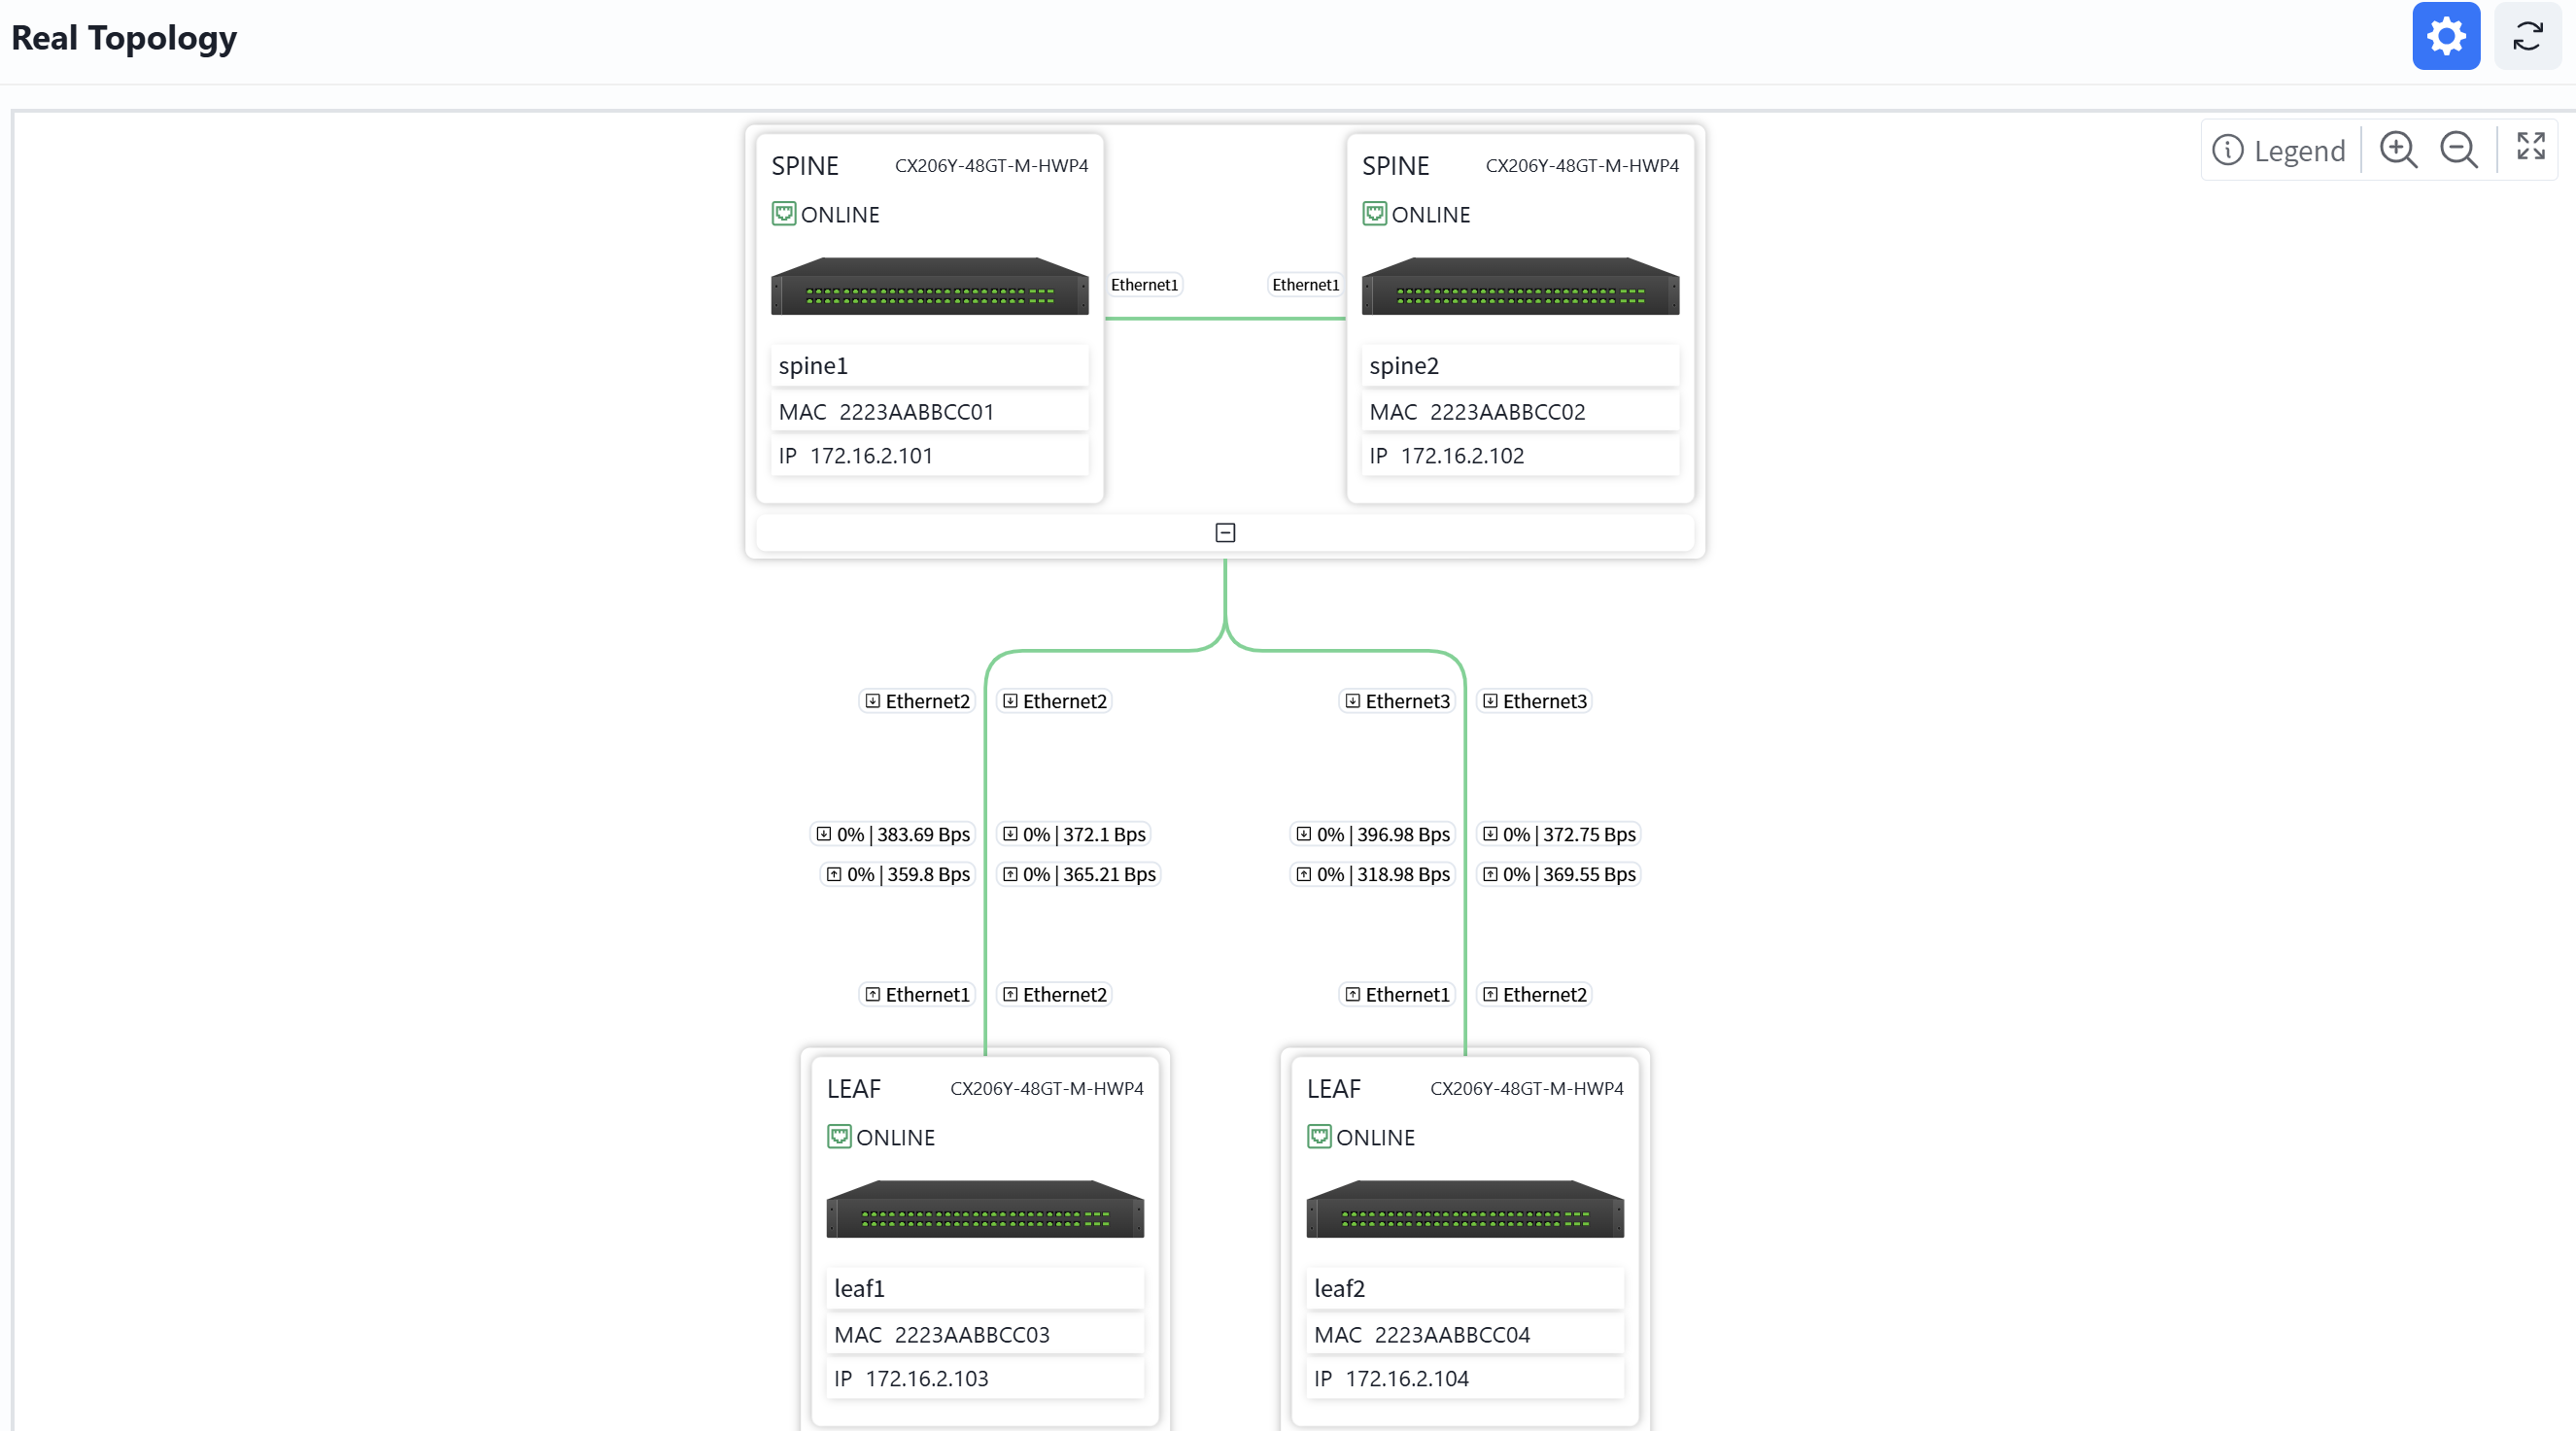
Real Topology
Section titled “Real Topology”In the venue, users can view device information and connection information on the real topology view, and double-click to enter the device’s details interface.
Terminal Status Visualization
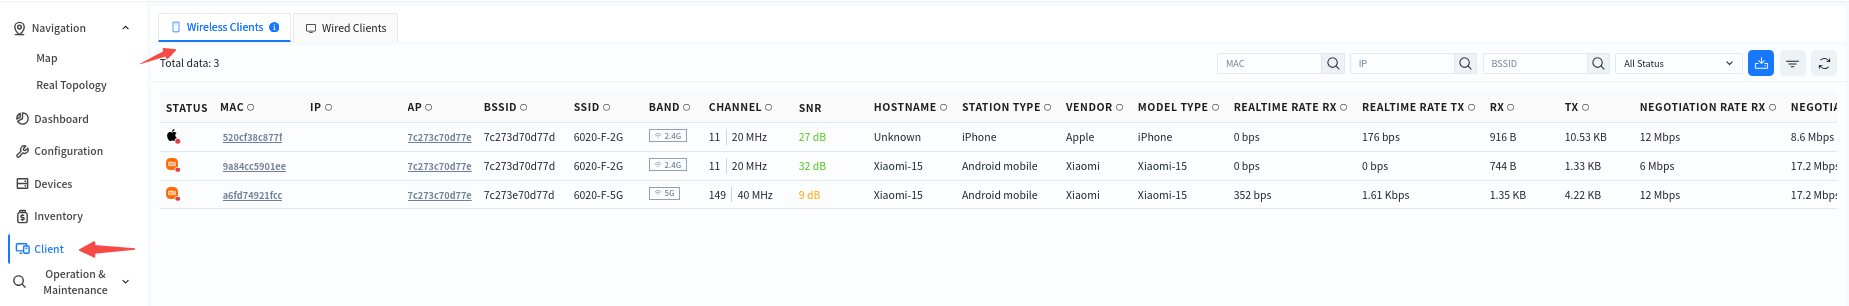
Section titled “Terminal Status Visualization”The controller supports collecting data of wired and wireless terminals online and visually presenting the status of online users. After entering a specified organization/venue, administrators can click [Client] to view information of all terminals under the organization/venue.
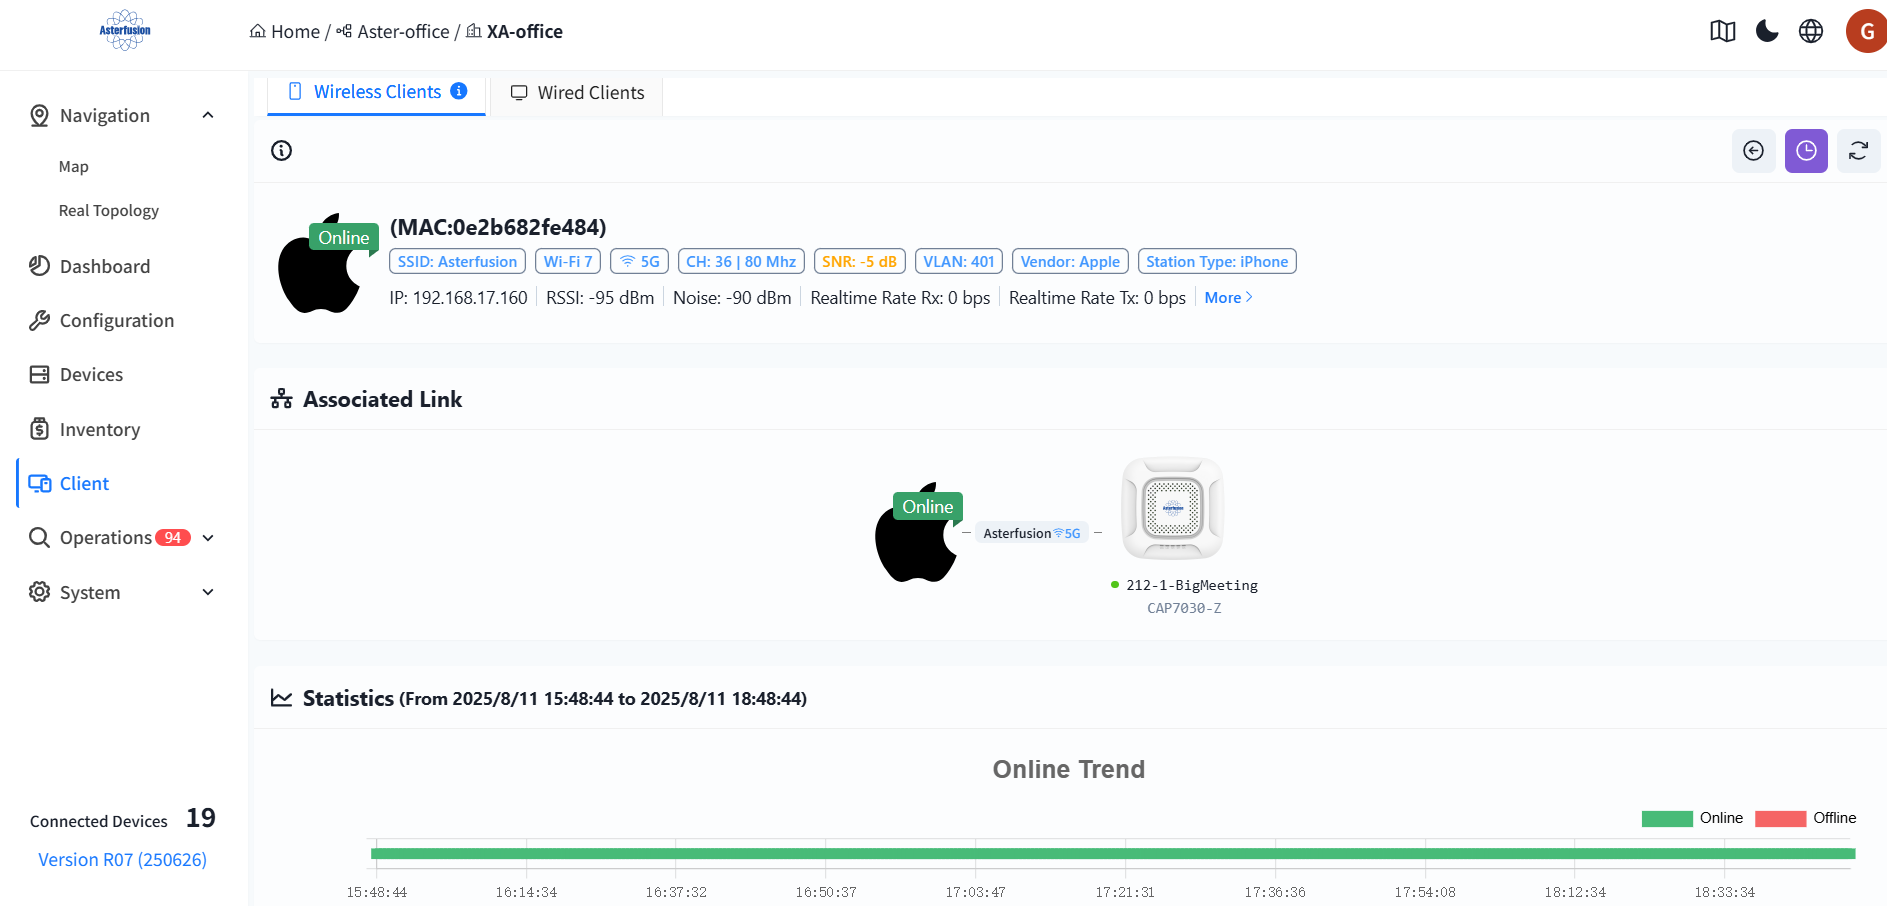
Click on the MAC address of the terminal to enter the detailed view and view detailed data such as the online trend, associated AP trend, SNR trend, and traffic statistics of the terminal. This helps administrators analyze the network connection status of the terminal within a specific time frame.

Device Status Visualization
Section titled “Device Status Visualization”Click [Device] - [Device MAC] to enter the management interface of the specified device and view the detailed information of this device:
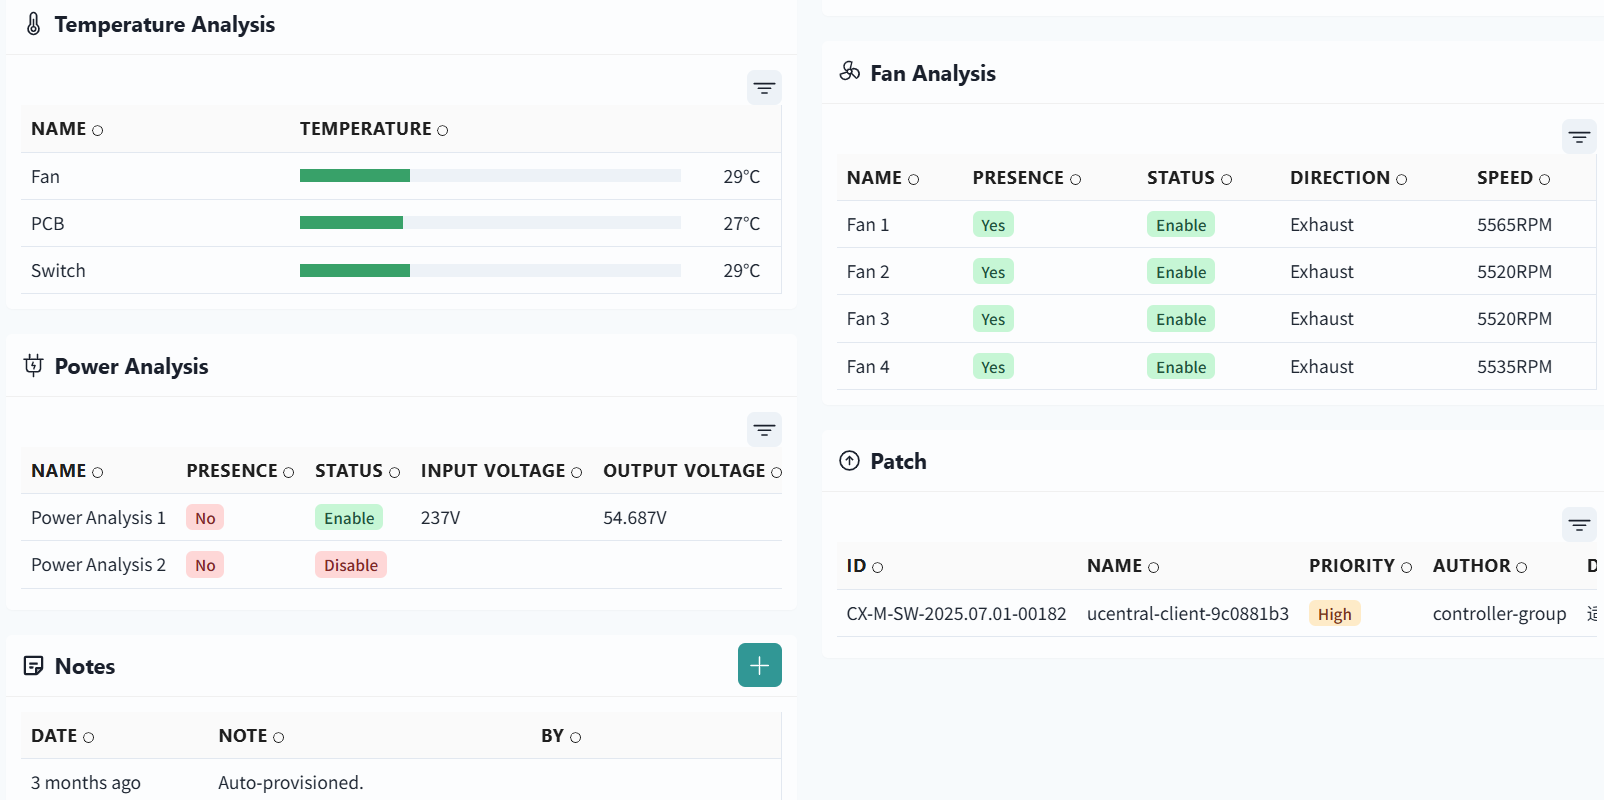
Overview of Device Information
Section titled “Overview of Device Information”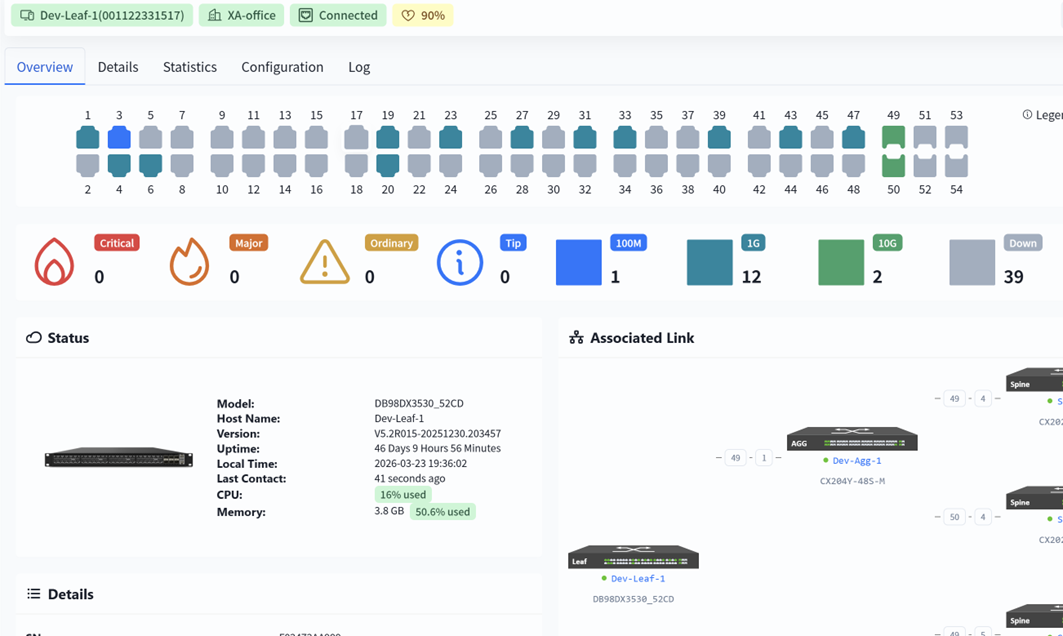
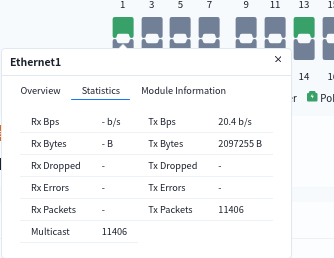
Users can hover the mouse over the interface to view detailed information about it
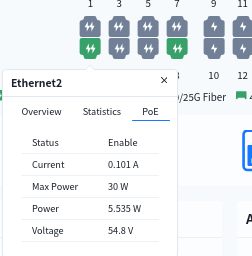
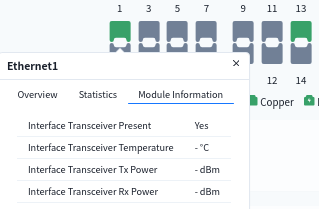
View device details
Section titled “View device details”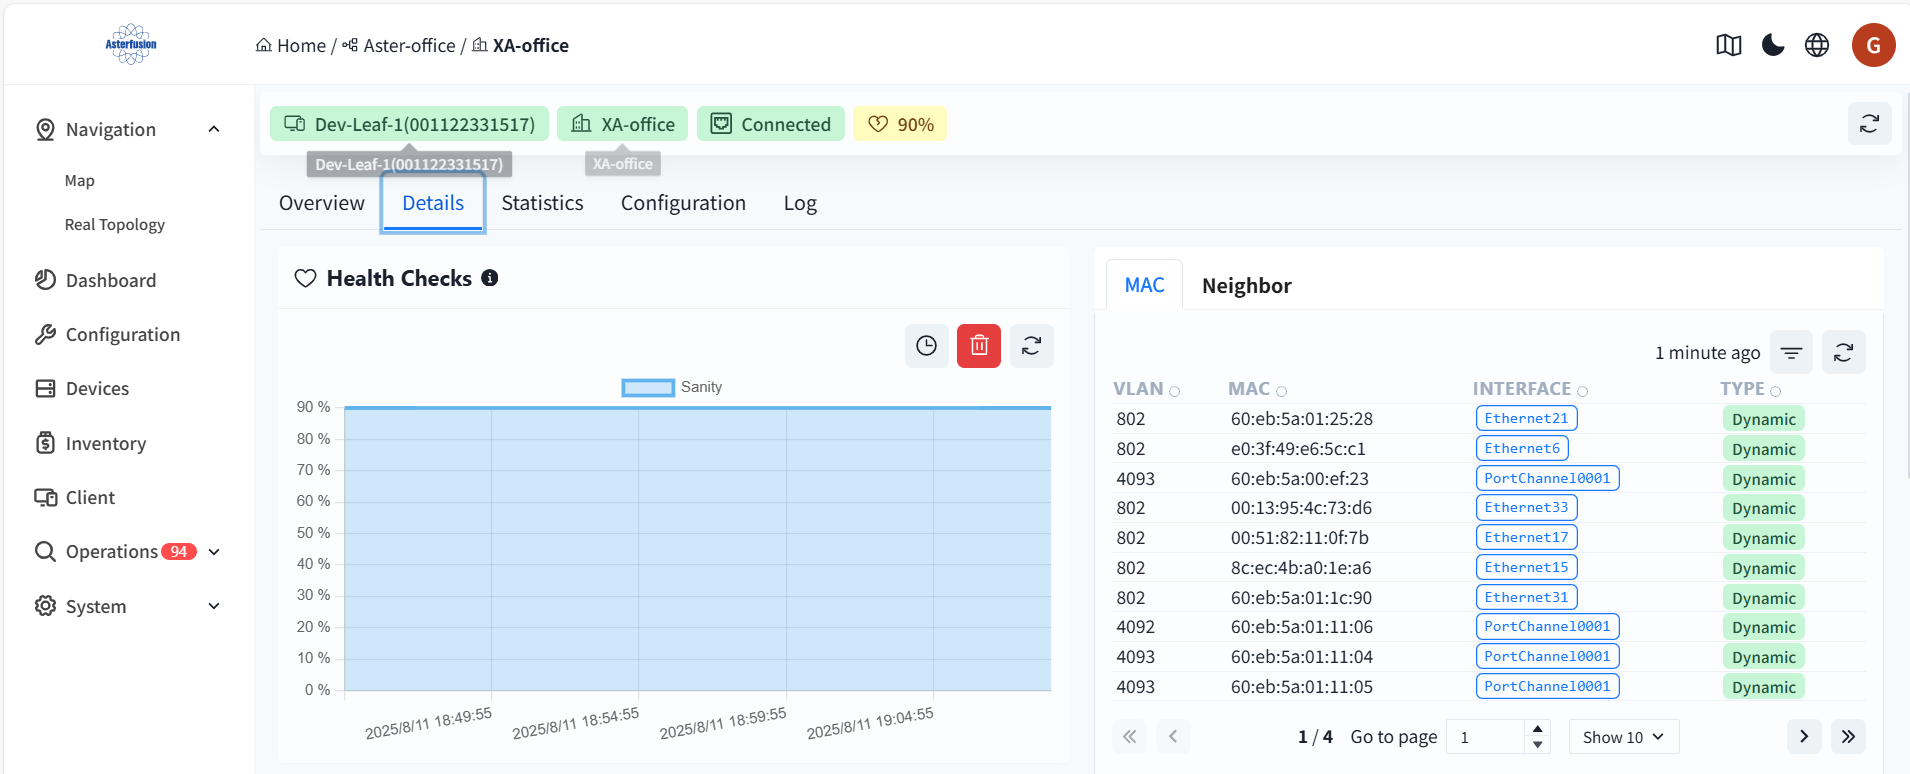
Health Checks
The initial health check value for both the switch and the AP is 100%.
- Health check calculation specification for the switch: CPU utilization over 80%, soundness reduced by 10% Memory utilization over 80%, soundness reduced by 10% Switch chip/CPU temperature over 85°C, soundness reduced by 10% PSU any one power supply status abnormality (power module not in position, power supply not powered), soundness minus 10% Service detection: any critical business service abnormality, soundness minus 10%
- AP Health Check Calculation Rule: interface can successfully detect the DHCP/DNS server information is normal interface, integrity = normal interface/total number of interfaces.
MAC
The MAC address table (CAM table) of the switch records the mapping relationships between the MAC addresses learned by the switch, ports, and VLANs.
- VLAN: The VLAN ID to which the MAC address belongs, used to identify different broadcast domains.
- MAC: The learned device MAC address (source MAC address).
- Interface: The switch port corresponding to the MAC address (EthernetXX: Physical port, PortChannelXXXX: Link aggregation group).
- Type: Item generation method (Dynamic: Automatically learned by monitoring data frames; Static: Manually configured by the administrator)。
Neighbor information (ARP)
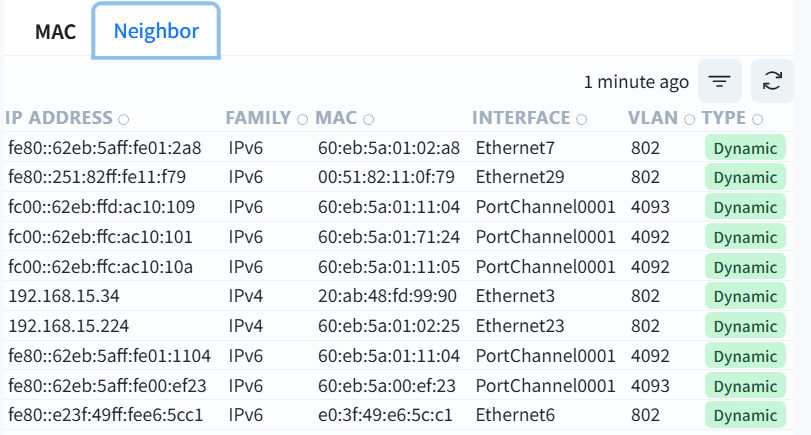
This table is the neighbor discovery table of the switch (NDP for IPv6/ARP for IPv4), which records the IP-MAC mapping relationship of devices directly connected to the local switch.
- IP address: IP address (IPv4/IPv6) of the neighbor device
- Family: IPv4 or IPv6 protocol type
- MAC: The physical address of the neighbor device
- Interface: The port of the local switch connected to this neighbor
- VLAN: The virtual local area network where the communication takes place
- Type: Dynamic (automatic protocol learning) or Static (manual configuration)
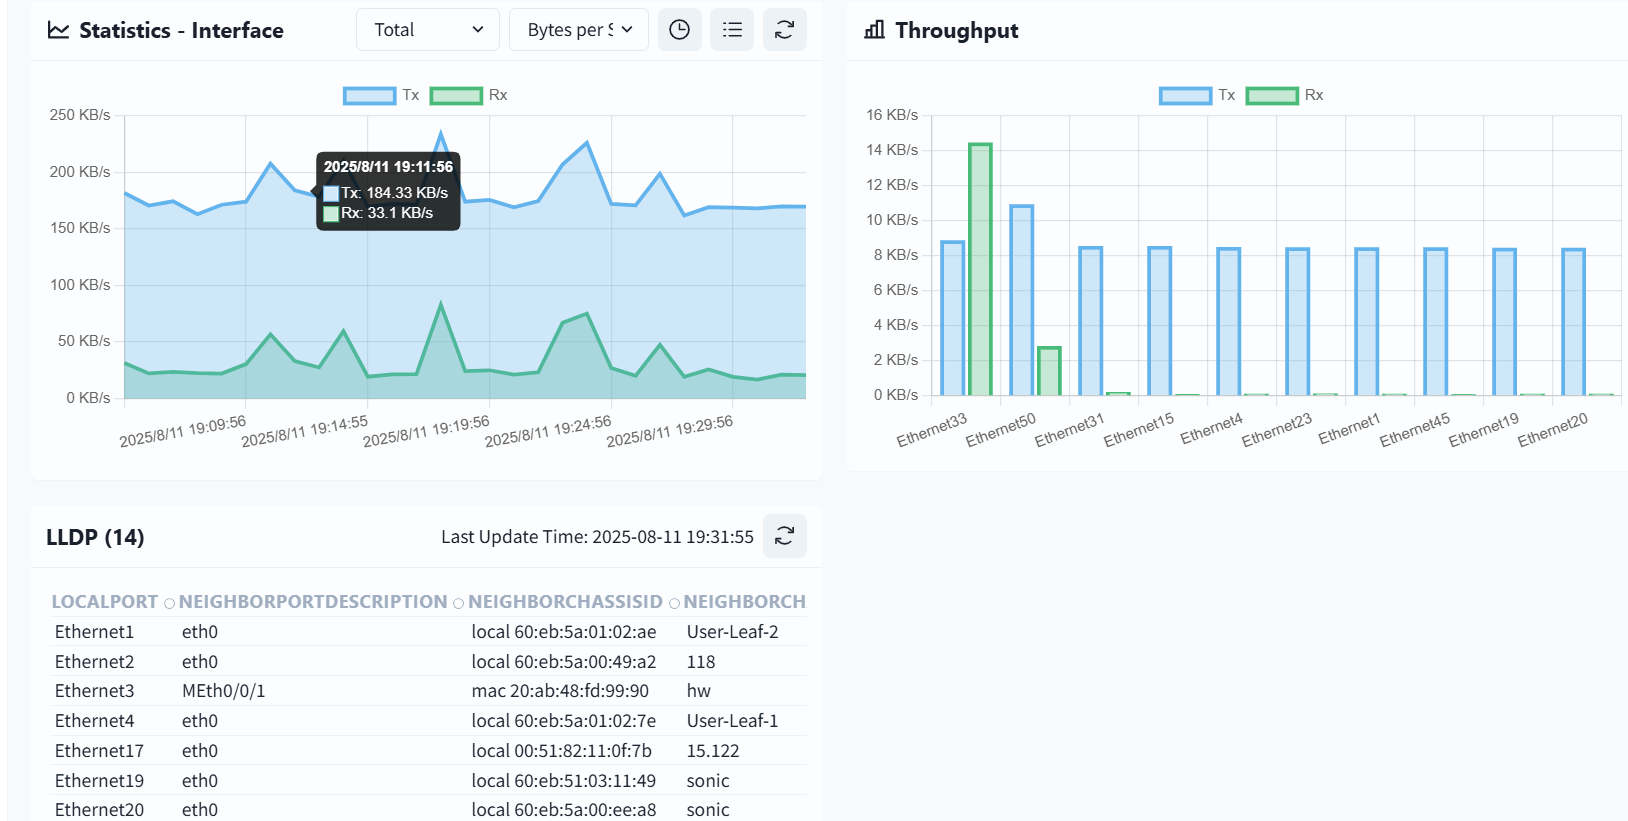
View device statistics
Section titled “View device statistics”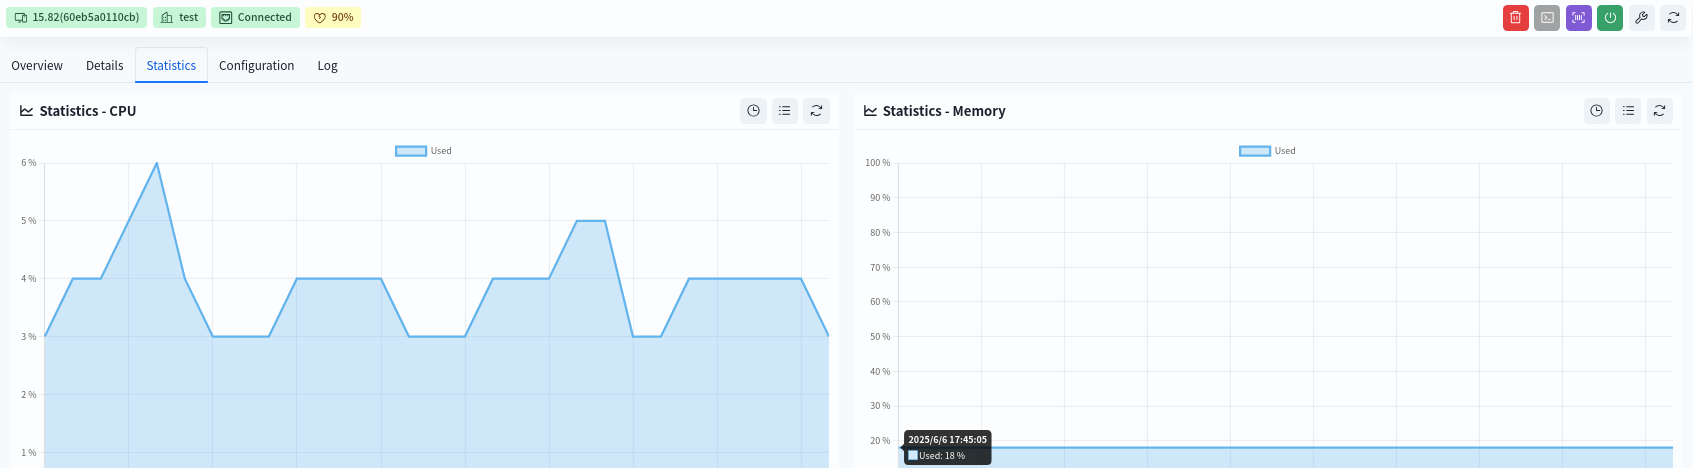
View device configuration information
Section titled “View device configuration information”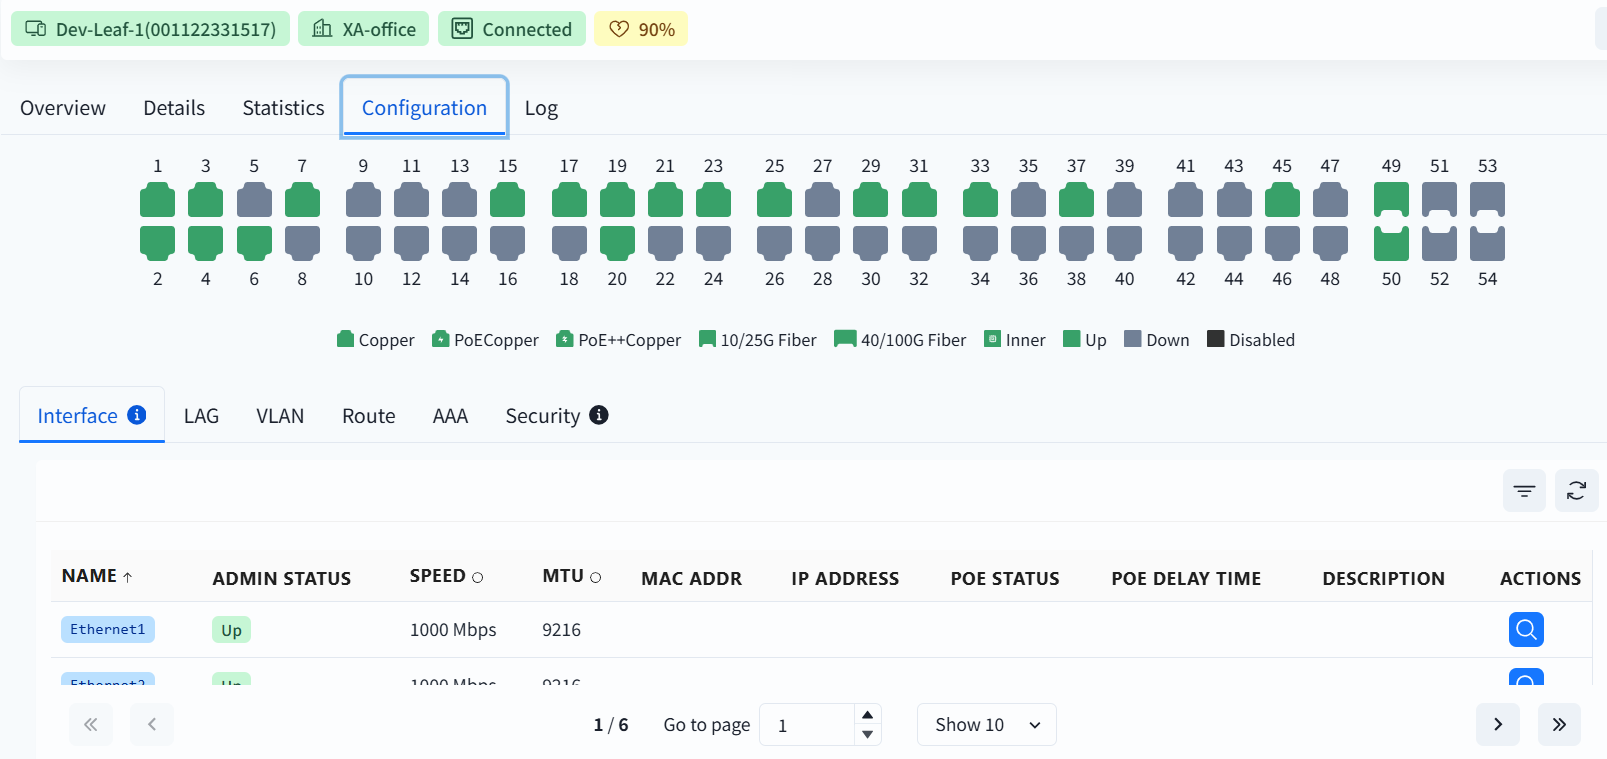
Display the configuration information of device interfaces, LAG, VLAN, routing, authentication, and security.
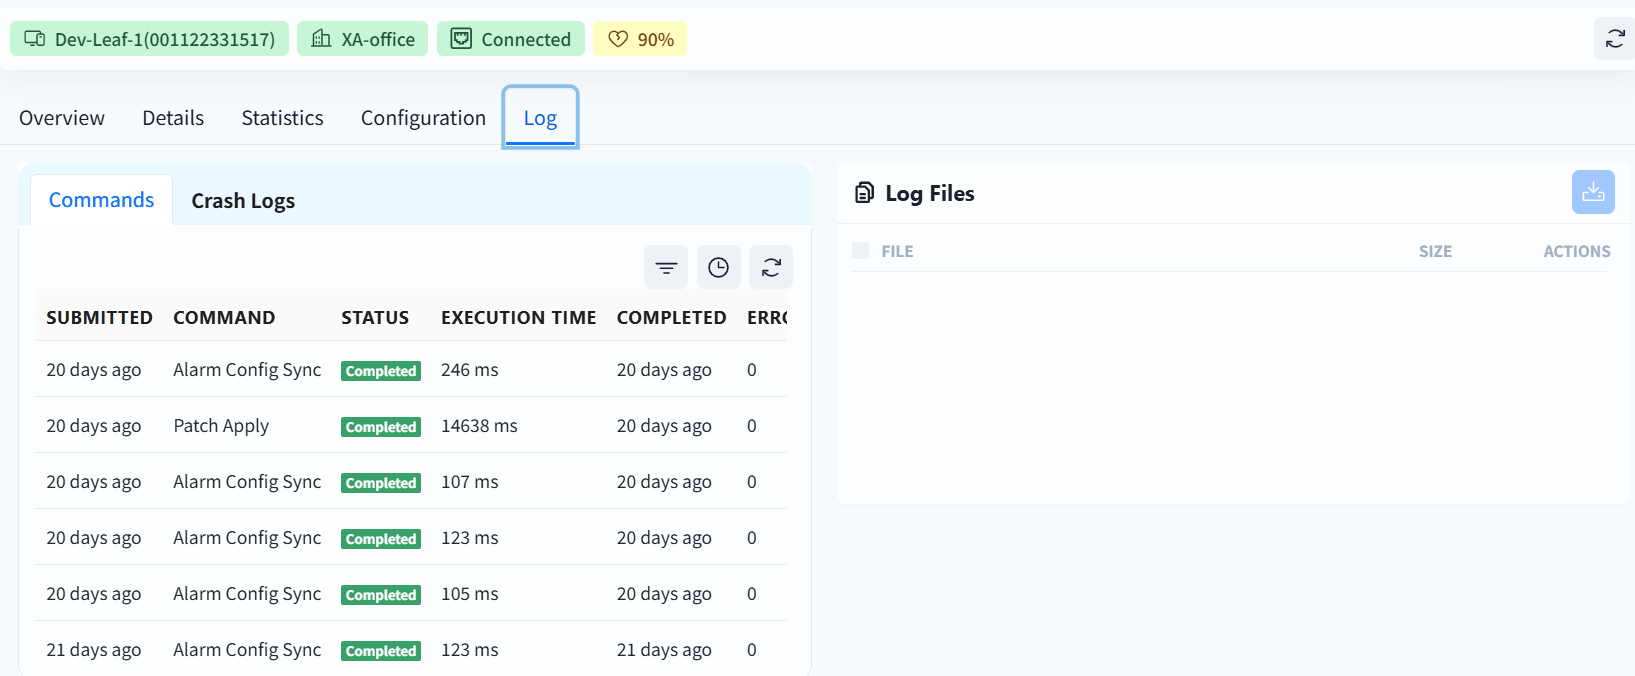
View device log information
Section titled “View device log information”